Immigrants from Lebanon vs Korean Median Family Income
COMPARE
Immigrants from Lebanon
Korean
Median Family Income
Median Family Income Comparison
Immigrants from Lebanon
Koreans
$110,159
MEDIAN FAMILY INCOME
97.9/ 100
METRIC RATING
92nd/ 347
METRIC RANK
$110,103
MEDIAN FAMILY INCOME
97.8/ 100
METRIC RATING
94th/ 347
METRIC RANK
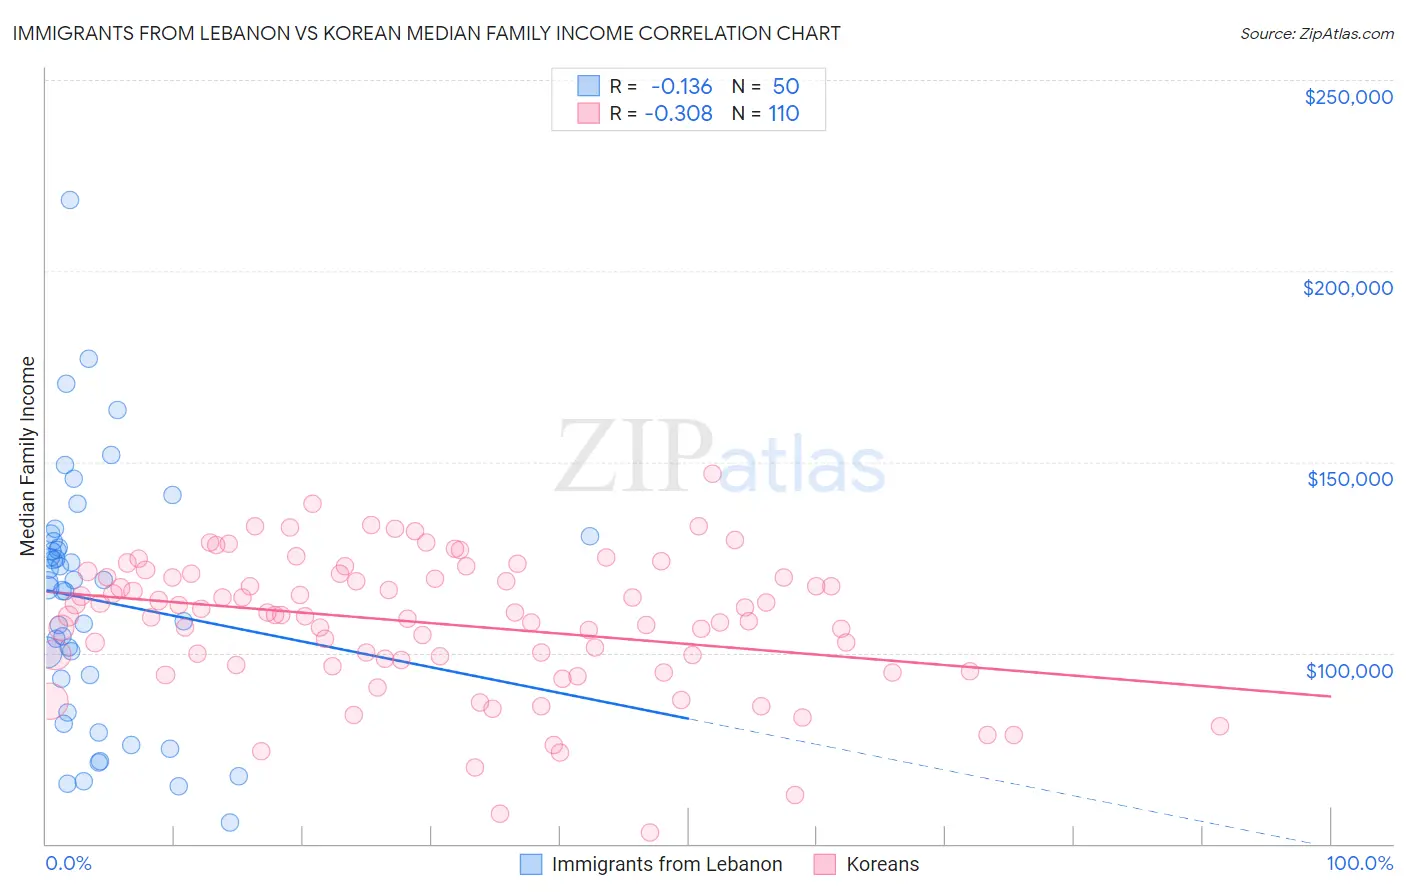
Immigrants from Lebanon vs Korean Median Family Income Correlation Chart
The statistical analysis conducted on geographies consisting of 217,094,496 people shows a poor negative correlation between the proportion of Immigrants from Lebanon and median family income in the United States with a correlation coefficient (R) of -0.136 and weighted average of $110,159. Similarly, the statistical analysis conducted on geographies consisting of 510,104,547 people shows a mild negative correlation between the proportion of Koreans and median family income in the United States with a correlation coefficient (R) of -0.308 and weighted average of $110,103, a difference of 0.050%.
Median Family Income Correlation Summary
| Measurement | Immigrants from Lebanon | Korean |
| Minimum | $55,430 | $53,031 |
| Maximum | $218,700 | $146,906 |
| Range | $163,270 | $93,875 |
| Mean | $113,756 | $107,726 |
| Median | $117,906 | $109,878 |
| Interquartile 25% (IQ1) | $93,082 | $98,078 |
| Interquartile 75% (IQ3) | $129,106 | $119,779 |
| Interquartile Range (IQR) | $36,025 | $21,701 |
| Standard Deviation (Sample) | $32,559 | $17,855 |
| Standard Deviation (Population) | $32,232 | $17,774 |
Demographics Similar to Immigrants from Lebanon and Koreans by Median Family Income
In terms of median family income, the demographic groups most similar to Immigrants from Lebanon are Immigrants from Kazakhstan ($110,137, a difference of 0.020%), Zimbabwean ($110,011, a difference of 0.13%), Immigrants from Moldova ($109,975, a difference of 0.17%), Jordanian ($109,865, a difference of 0.27%), and Immigrants from Kuwait ($109,731, a difference of 0.39%). Similarly, the demographic groups most similar to Koreans are Immigrants from Kazakhstan ($110,137, a difference of 0.030%), Zimbabwean ($110,011, a difference of 0.080%), Immigrants from Moldova ($109,975, a difference of 0.12%), Jordanian ($109,865, a difference of 0.22%), and Immigrants from Kuwait ($109,731, a difference of 0.34%).
| Demographics | Rating | Rank | Median Family Income |
| Immigrants | Egypt | 99.0 /100 | #83 | Exceptional $111,689 |
| Immigrants | Hungary | 98.8 /100 | #84 | Exceptional $111,378 |
| Croatians | 98.8 /100 | #85 | Exceptional $111,370 |
| Ukrainians | 98.8 /100 | #86 | Exceptional $111,368 |
| Austrians | 98.8 /100 | #87 | Exceptional $111,306 |
| Romanians | 98.8 /100 | #88 | Exceptional $111,243 |
| Immigrants | Argentina | 98.5 /100 | #89 | Exceptional $110,873 |
| Northern Europeans | 98.3 /100 | #90 | Exceptional $110,635 |
| Immigrants | Southern Europe | 98.3 /100 | #91 | Exceptional $110,614 |
| Immigrants | Lebanon | 97.9 /100 | #92 | Exceptional $110,159 |
| Immigrants | Kazakhstan | 97.8 /100 | #93 | Exceptional $110,137 |
| Koreans | 97.8 /100 | #94 | Exceptional $110,103 |
| Zimbabweans | 97.7 /100 | #95 | Exceptional $110,011 |
| Immigrants | Moldova | 97.7 /100 | #96 | Exceptional $109,975 |
| Jordanians | 97.5 /100 | #97 | Exceptional $109,865 |
| Immigrants | Kuwait | 97.4 /100 | #98 | Exceptional $109,731 |
| Armenians | 97.3 /100 | #99 | Exceptional $109,692 |
| Macedonians | 97.3 /100 | #100 | Exceptional $109,668 |
| Immigrants | Ukraine | 97.2 /100 | #101 | Exceptional $109,645 |
| Assyrians/Chaldeans/Syriacs | 97.2 /100 | #102 | Exceptional $109,622 |
| Immigrants | Brazil | 96.9 /100 | #103 | Exceptional $109,418 |