Blackfeet vs Immigrants from West Indies Single Father Poverty
COMPARE
Blackfeet
Immigrants from West Indies
Single Father Poverty
Single Father Poverty Comparison
Blackfeet
Immigrants from West Indies
18.5%
SINGLE FATHER POVERTY
0.0/ 100
METRIC RATING
305th/ 347
METRIC RANK
15.9%
SINGLE FATHER POVERTY
90.8/ 100
METRIC RATING
129th/ 347
METRIC RANK
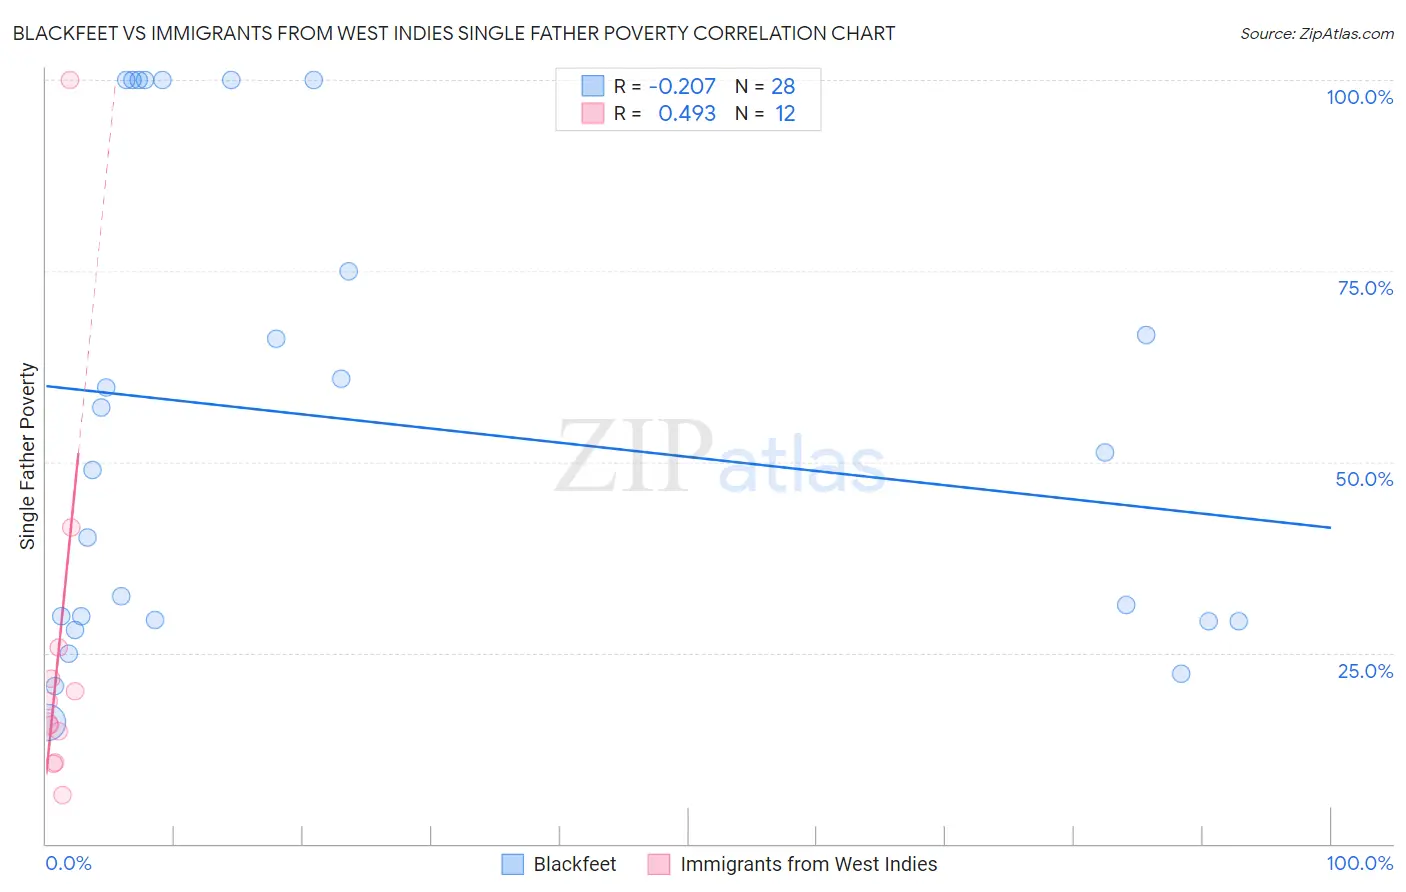
Blackfeet vs Immigrants from West Indies Single Father Poverty Correlation Chart
The statistical analysis conducted on geographies consisting of 259,730,501 people shows a weak negative correlation between the proportion of Blackfeet and poverty level among single fathers in the United States with a correlation coefficient (R) of -0.207 and weighted average of 18.5%. Similarly, the statistical analysis conducted on geographies consisting of 68,386,268 people shows a moderate positive correlation between the proportion of Immigrants from West Indies and poverty level among single fathers in the United States with a correlation coefficient (R) of 0.493 and weighted average of 15.9%, a difference of 16.6%.
Single Father Poverty Correlation Summary
| Measurement | Blackfeet | Immigrants from West Indies |
| Minimum | 15.8% | 6.4% |
| Maximum | 100.0% | 100.0% |
| Range | 84.2% | 93.6% |
| Mean | 55.3% | 25.1% |
| Median | 50.0% | 17.2% |
| Interquartile 25% (IQ1) | 29.2% | 12.7% |
| Interquartile 75% (IQ3) | 87.5% | 23.7% |
| Interquartile Range (IQR) | 58.3% | 11.0% |
| Standard Deviation (Sample) | 30.4% | 25.3% |
| Standard Deviation (Population) | 29.8% | 24.2% |
Similar Demographics by Single Father Poverty
Demographics Similar to Blackfeet by Single Father Poverty
In terms of single father poverty, the demographic groups most similar to Blackfeet are Ute (18.5%, a difference of 0.050%), Celtic (18.5%, a difference of 0.19%), Scotch-Irish (18.6%, a difference of 0.22%), Comanche (18.5%, a difference of 0.23%), and French Canadian (18.6%, a difference of 0.26%).
| Demographics | Rating | Rank | Single Father Poverty |
| Africans | 0.0 /100 | #298 | Tragic 18.3% |
| Whites/Caucasians | 0.0 /100 | #299 | Tragic 18.4% |
| Immigrants | Dominican Republic | 0.0 /100 | #300 | Tragic 18.4% |
| Hungarians | 0.0 /100 | #301 | Tragic 18.5% |
| Comanche | 0.0 /100 | #302 | Tragic 18.5% |
| Celtics | 0.0 /100 | #303 | Tragic 18.5% |
| Ute | 0.0 /100 | #304 | Tragic 18.5% |
| Blackfeet | 0.0 /100 | #305 | Tragic 18.5% |
| Scotch-Irish | 0.0 /100 | #306 | Tragic 18.6% |
| French Canadians | 0.0 /100 | #307 | Tragic 18.6% |
| Ottawa | 0.0 /100 | #308 | Tragic 18.6% |
| Immigrants | Micronesia | 0.0 /100 | #309 | Tragic 18.6% |
| Chippewa | 0.0 /100 | #310 | Tragic 18.8% |
| Immigrants | Nonimmigrants | 0.0 /100 | #311 | Tragic 18.8% |
| Immigrants | Dominica | 0.0 /100 | #312 | Tragic 18.9% |
Demographics Similar to Immigrants from West Indies by Single Father Poverty
In terms of single father poverty, the demographic groups most similar to Immigrants from West Indies are Immigrants from Nigeria (15.9%, a difference of 0.0%), Immigrants from Liberia (15.9%, a difference of 0.040%), Hmong (15.9%, a difference of 0.050%), Iraqi (15.9%, a difference of 0.060%), and Palestinian (15.9%, a difference of 0.070%).
| Demographics | Rating | Rank | Single Father Poverty |
| Sudanese | 91.6 /100 | #122 | Exceptional 15.9% |
| Palestinians | 91.3 /100 | #123 | Exceptional 15.9% |
| Immigrants | Panama | 91.3 /100 | #124 | Exceptional 15.9% |
| Iraqis | 91.2 /100 | #125 | Exceptional 15.9% |
| Hmong | 91.1 /100 | #126 | Exceptional 15.9% |
| Immigrants | Liberia | 91.1 /100 | #127 | Exceptional 15.9% |
| Immigrants | Nigeria | 90.8 /100 | #128 | Exceptional 15.9% |
| Immigrants | West Indies | 90.8 /100 | #129 | Exceptional 15.9% |
| Norwegians | 90.2 /100 | #130 | Exceptional 15.9% |
| Nicaraguans | 90.1 /100 | #131 | Exceptional 15.9% |
| Immigrants | Portugal | 89.7 /100 | #132 | Excellent 15.9% |
| Immigrants | Syria | 89.5 /100 | #133 | Excellent 15.9% |
| Immigrants | South America | 88.5 /100 | #134 | Excellent 15.9% |
| Immigrants | Sri Lanka | 88.2 /100 | #135 | Excellent 15.9% |
| Cypriots | 87.5 /100 | #136 | Excellent 15.9% |