Czechoslovakian vs Immigrants from St. Vincent and the Grenadines Median Earnings
COMPARE
Czechoslovakian
Immigrants from St. Vincent and the Grenadines
Median Earnings
Median Earnings Comparison
Czechoslovakians
Immigrants from St. Vincent and the Grenadines
$46,658
MEDIAN EARNINGS
57.8/ 100
METRIC RATING
166th/ 347
METRIC RANK
$45,908
MEDIAN EARNINGS
32.4/ 100
METRIC RATING
195th/ 347
METRIC RANK
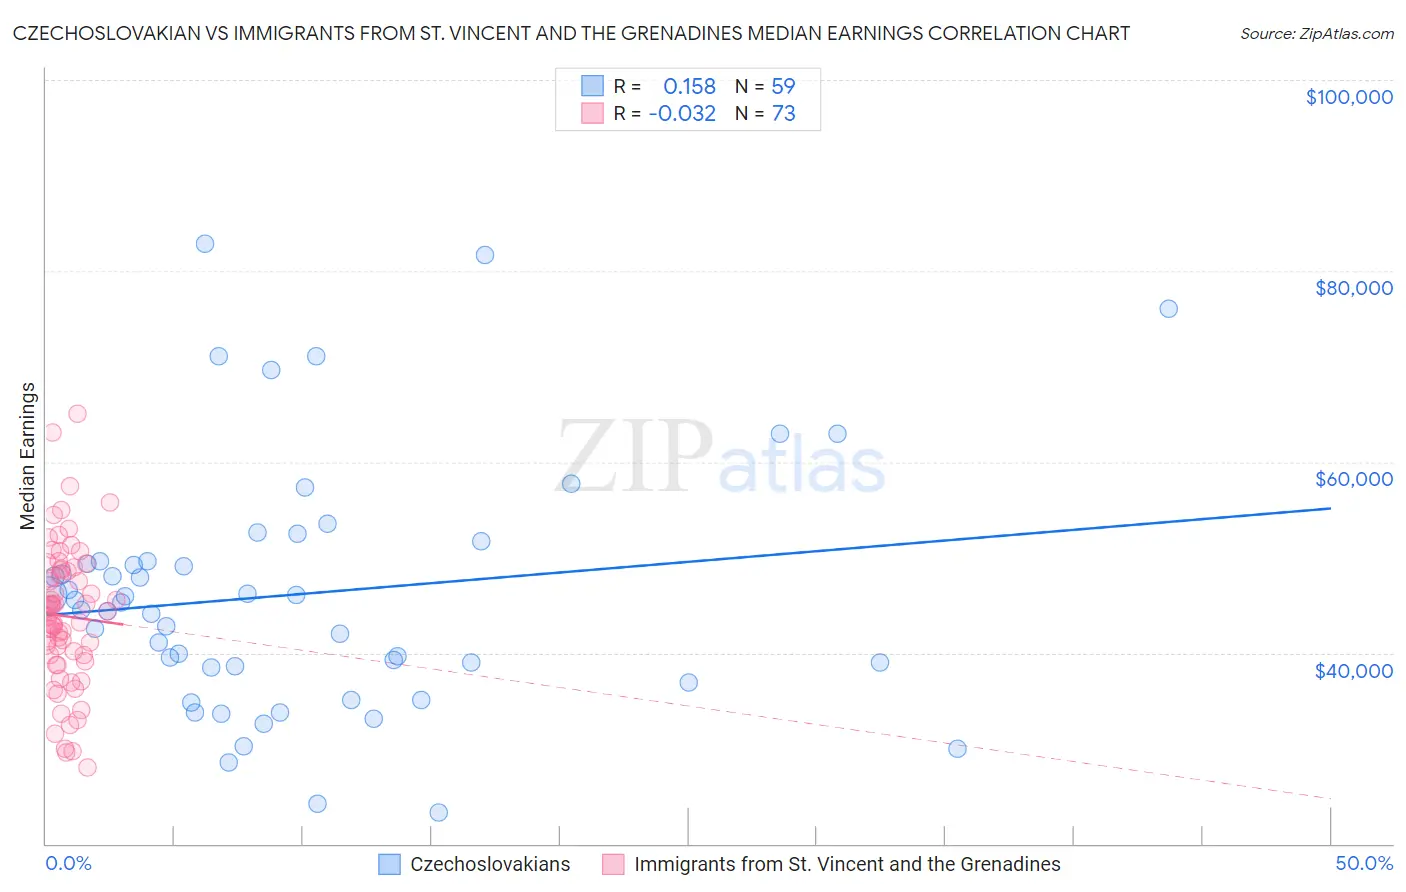
Czechoslovakian vs Immigrants from St. Vincent and the Grenadines Median Earnings Correlation Chart
The statistical analysis conducted on geographies consisting of 368,633,648 people shows a poor positive correlation between the proportion of Czechoslovakians and median earnings in the United States with a correlation coefficient (R) of 0.158 and weighted average of $46,658. Similarly, the statistical analysis conducted on geographies consisting of 56,194,678 people shows no correlation between the proportion of Immigrants from St. Vincent and the Grenadines and median earnings in the United States with a correlation coefficient (R) of -0.032 and weighted average of $45,908, a difference of 1.6%.
Median Earnings Correlation Summary
| Measurement | Czechoslovakian | Immigrants from St. Vincent and the Grenadines |
| Minimum | $23,333 | $27,951 |
| Maximum | $82,793 | $65,069 |
| Range | $59,460 | $37,118 |
| Mean | $46,151 | $43,851 |
| Median | $45,298 | $43,770 |
| Interquartile 25% (IQ1) | $38,524 | $39,492 |
| Interquartile 75% (IQ3) | $49,625 | $48,733 |
| Interquartile Range (IQR) | $11,101 | $9,241 |
| Standard Deviation (Sample) | $13,082 | $7,478 |
| Standard Deviation (Population) | $12,971 | $7,427 |
Similar Demographics by Median Earnings
Demographics Similar to Czechoslovakians by Median Earnings
In terms of median earnings, the demographic groups most similar to Czechoslovakians are Costa Rican ($46,645, a difference of 0.030%), Immigrants from Africa ($46,564, a difference of 0.20%), Immigrants from South America ($46,548, a difference of 0.24%), South American ($46,804, a difference of 0.31%), and Immigrants ($46,478, a difference of 0.39%).
| Demographics | Rating | Rank | Median Earnings |
| Immigrants | Peru | 69.6 /100 | #159 | Good $47,025 |
| Alsatians | 69.6 /100 | #160 | Good $47,023 |
| Immigrants | Eastern Africa | 68.0 /100 | #161 | Good $46,969 |
| South American Indians | 67.4 /100 | #162 | Good $46,952 |
| Icelanders | 66.3 /100 | #163 | Good $46,916 |
| Norwegians | 64.7 /100 | #164 | Good $46,865 |
| South Americans | 62.7 /100 | #165 | Good $46,804 |
| Czechoslovakians | 57.8 /100 | #166 | Average $46,658 |
| Costa Ricans | 57.4 /100 | #167 | Average $46,645 |
| Immigrants | Africa | 54.6 /100 | #168 | Average $46,564 |
| Immigrants | South America | 54.0 /100 | #169 | Average $46,548 |
| Immigrants | Immigrants | 51.6 /100 | #170 | Average $46,478 |
| Scottish | 51.1 /100 | #171 | Average $46,463 |
| Kenyans | 51.0 /100 | #172 | Average $46,462 |
| Ghanaians | 50.3 /100 | #173 | Average $46,440 |
Demographics Similar to Immigrants from St. Vincent and the Grenadines by Median Earnings
In terms of median earnings, the demographic groups most similar to Immigrants from St. Vincent and the Grenadines are Immigrants from Costa Rica ($45,928, a difference of 0.040%), German ($45,935, a difference of 0.060%), Guamanian/Chamorro ($45,933, a difference of 0.060%), Finnish ($45,940, a difference of 0.070%), and Yugoslavian ($45,846, a difference of 0.13%).
| Demographics | Rating | Rank | Median Earnings |
| Immigrants | Armenia | 38.3 /100 | #188 | Fair $46,094 |
| Spaniards | 37.2 /100 | #189 | Fair $46,059 |
| French Canadians | 36.1 /100 | #190 | Fair $46,026 |
| Finns | 33.4 /100 | #191 | Fair $45,940 |
| Germans | 33.2 /100 | #192 | Fair $45,935 |
| Guamanians/Chamorros | 33.2 /100 | #193 | Fair $45,933 |
| Immigrants | Costa Rica | 33.0 /100 | #194 | Fair $45,928 |
| Immigrants | St. Vincent and the Grenadines | 32.4 /100 | #195 | Fair $45,908 |
| Yugoslavians | 30.5 /100 | #196 | Fair $45,846 |
| Barbadians | 30.5 /100 | #197 | Fair $45,846 |
| Trinidadians and Tobagonians | 29.7 /100 | #198 | Fair $45,820 |
| Immigrants | Barbados | 29.6 /100 | #199 | Fair $45,816 |
| Immigrants | Azores | 29.5 /100 | #200 | Fair $45,812 |
| Celtics | 27.2 /100 | #201 | Fair $45,732 |
| Immigrants | Trinidad and Tobago | 27.1 /100 | #202 | Fair $45,729 |