Blackfeet vs Immigrants from St. Vincent and the Grenadines Householder Income Ages 45 - 64 years
COMPARE
Blackfeet
Immigrants from St. Vincent and the Grenadines
Householder Income Ages 45 - 64 years
Householder Income Ages 45 - 64 years Comparison
Blackfeet
Immigrants from St. Vincent and the Grenadines
$86,595
HOUSEHOLDER INCOME AGES 45 - 64 YEARS
0.1/ 100
METRIC RATING
285th/ 347
METRIC RANK
$86,394
HOUSEHOLDER INCOME AGES 45 - 64 YEARS
0.1/ 100
METRIC RATING
288th/ 347
METRIC RANK
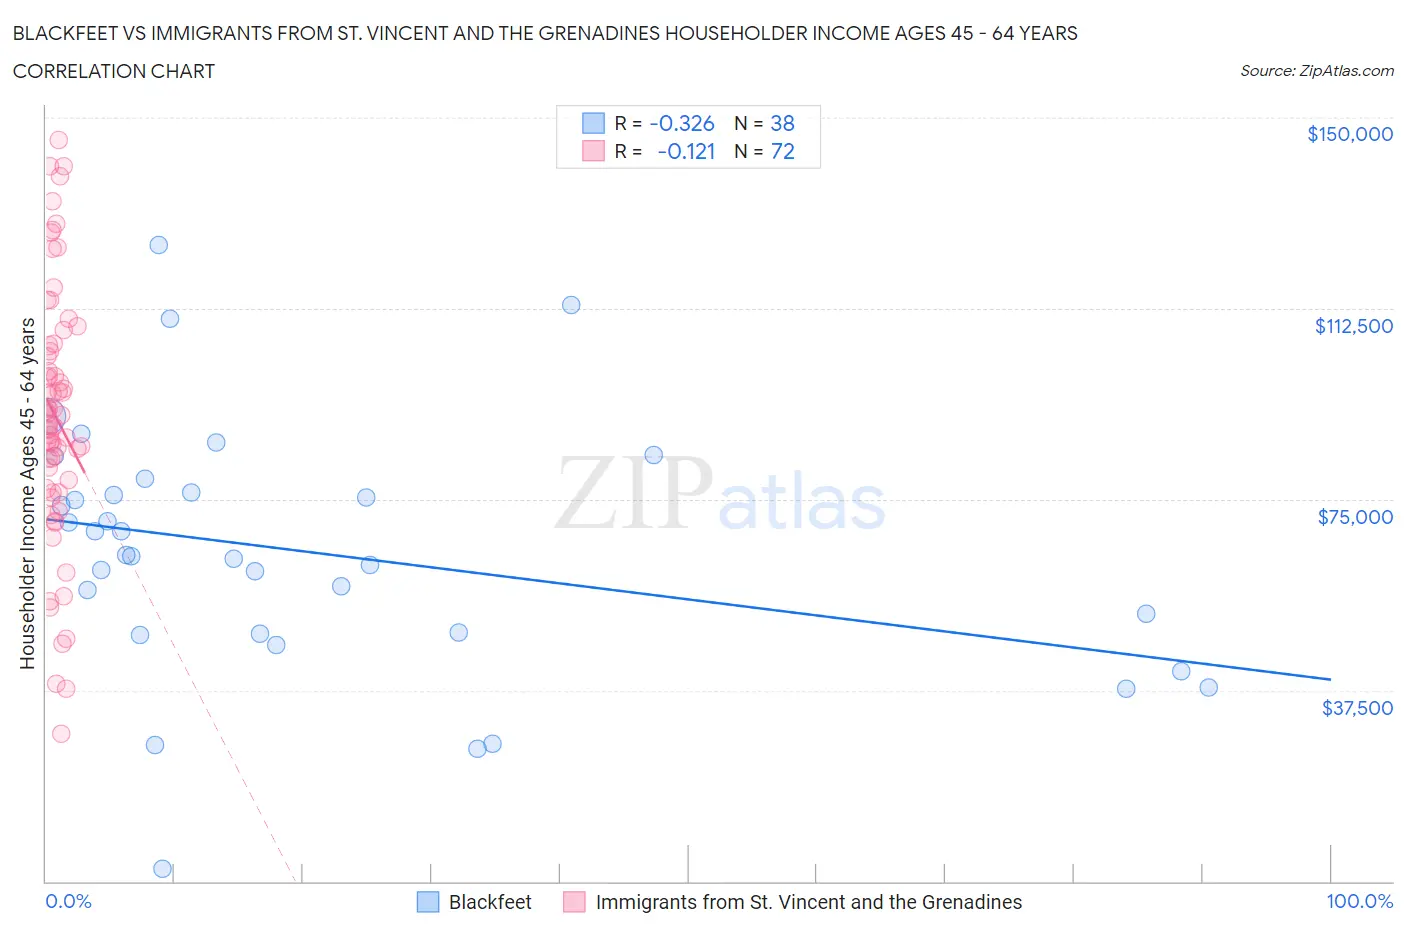
Blackfeet vs Immigrants from St. Vincent and the Grenadines Householder Income Ages 45 - 64 years Correlation Chart
The statistical analysis conducted on geographies consisting of 309,065,778 people shows a mild negative correlation between the proportion of Blackfeet and household income with householder between the ages 45 and 64 in the United States with a correlation coefficient (R) of -0.326 and weighted average of $86,595. Similarly, the statistical analysis conducted on geographies consisting of 56,172,416 people shows a poor negative correlation between the proportion of Immigrants from St. Vincent and the Grenadines and household income with householder between the ages 45 and 64 in the United States with a correlation coefficient (R) of -0.121 and weighted average of $86,394, a difference of 0.23%.
Householder Income Ages 45 - 64 years Correlation Summary
| Measurement | Blackfeet | Immigrants from St. Vincent and the Grenadines |
| Minimum | $2,499 | $29,032 |
| Maximum | $124,961 | $145,625 |
| Range | $122,462 | $116,593 |
| Mean | $64,472 | $91,362 |
| Median | $63,965 | $90,616 |
| Interquartile 25% (IQ1) | $48,500 | $78,013 |
| Interquartile 75% (IQ3) | $76,463 | $104,689 |
| Interquartile Range (IQR) | $27,963 | $26,677 |
| Standard Deviation (Sample) | $24,942 | $24,861 |
| Standard Deviation (Population) | $24,611 | $24,688 |
Demographics Similar to Blackfeet and Immigrants from St. Vincent and the Grenadines by Householder Income Ages 45 - 64 years
In terms of householder income ages 45 - 64 years, the demographic groups most similar to Blackfeet are Immigrants from Guatemala ($86,573, a difference of 0.030%), Central American Indian ($86,764, a difference of 0.20%), Bangladeshi ($86,402, a difference of 0.22%), Mexican ($86,816, a difference of 0.25%), and Cuban ($86,301, a difference of 0.34%). Similarly, the demographic groups most similar to Immigrants from St. Vincent and the Grenadines are Bangladeshi ($86,402, a difference of 0.010%), Cuban ($86,301, a difference of 0.11%), Immigrants from Guatemala ($86,573, a difference of 0.21%), Cherokee ($86,125, a difference of 0.31%), and Central American Indian ($86,764, a difference of 0.43%).
| Demographics | Rating | Rank | Householder Income Ages 45 - 64 years |
| Immigrants | Latin America | 0.1 /100 | #276 | Tragic $87,219 |
| Cree | 0.1 /100 | #277 | Tragic $87,185 |
| Immigrants | Jamaica | 0.1 /100 | #278 | Tragic $87,035 |
| Yakama | 0.1 /100 | #279 | Tragic $86,992 |
| Immigrants | Somalia | 0.1 /100 | #280 | Tragic $86,987 |
| Yaqui | 0.1 /100 | #281 | Tragic $86,914 |
| Senegalese | 0.1 /100 | #282 | Tragic $86,897 |
| Mexicans | 0.1 /100 | #283 | Tragic $86,816 |
| Central American Indians | 0.1 /100 | #284 | Tragic $86,764 |
| Blackfeet | 0.1 /100 | #285 | Tragic $86,595 |
| Immigrants | Guatemala | 0.1 /100 | #286 | Tragic $86,573 |
| Bangladeshis | 0.1 /100 | #287 | Tragic $86,402 |
| Immigrants | St. Vincent and the Grenadines | 0.1 /100 | #288 | Tragic $86,394 |
| Cubans | 0.1 /100 | #289 | Tragic $86,301 |
| Cherokee | 0.1 /100 | #290 | Tragic $86,125 |
| Hispanics or Latinos | 0.1 /100 | #291 | Tragic $86,006 |
| Immigrants | Central America | 0.1 /100 | #292 | Tragic $85,965 |
| Comanche | 0.1 /100 | #293 | Tragic $85,787 |
| British West Indians | 0.1 /100 | #294 | Tragic $85,571 |
| Immigrants | Grenada | 0.1 /100 | #295 | Tragic $85,552 |
| Immigrants | Zaire | 0.1 /100 | #296 | Tragic $85,207 |