Immigrants from Sierra Leone vs Immigrants from Grenada Median Family Income
COMPARE
Immigrants from Sierra Leone
Immigrants from Grenada
Median Family Income
Median Family Income Comparison
Immigrants from Sierra Leone
Immigrants from Grenada
$103,990
MEDIAN FAMILY INCOME
66.2/ 100
METRIC RATING
162nd/ 347
METRIC RANK
$89,249
MEDIAN FAMILY INCOME
0.1/ 100
METRIC RATING
278th/ 347
METRIC RANK
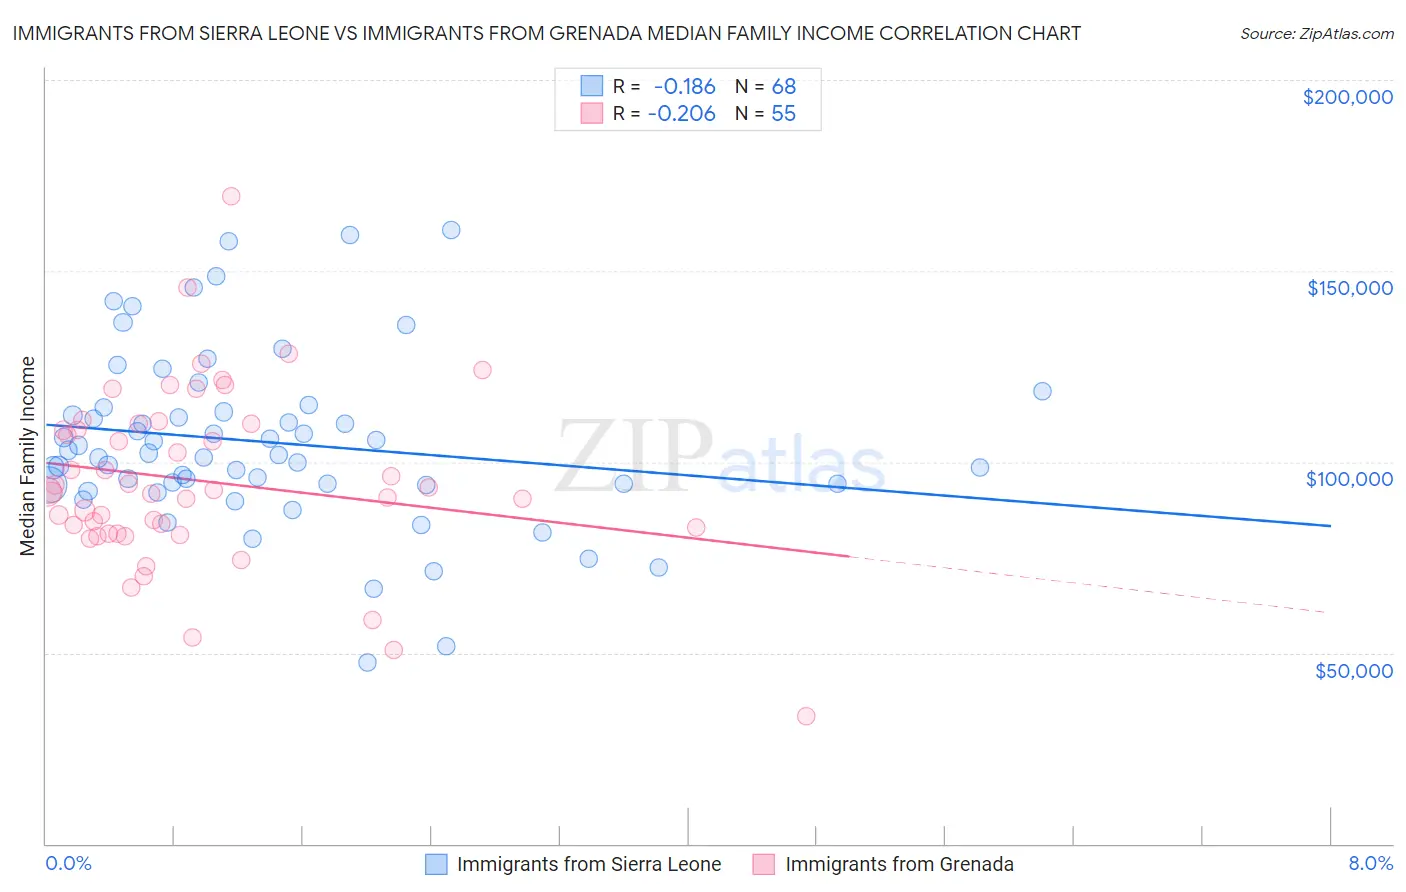
Immigrants from Sierra Leone vs Immigrants from Grenada Median Family Income Correlation Chart
The statistical analysis conducted on geographies consisting of 101,644,998 people shows a poor negative correlation between the proportion of Immigrants from Sierra Leone and median family income in the United States with a correlation coefficient (R) of -0.186 and weighted average of $103,990. Similarly, the statistical analysis conducted on geographies consisting of 67,181,093 people shows a weak negative correlation between the proportion of Immigrants from Grenada and median family income in the United States with a correlation coefficient (R) of -0.206 and weighted average of $89,249, a difference of 16.5%.
Median Family Income Correlation Summary
| Measurement | Immigrants from Sierra Leone | Immigrants from Grenada |
| Minimum | $47,578 | $33,250 |
| Maximum | $160,863 | $169,583 |
| Range | $113,285 | $136,333 |
| Mean | $105,117 | $95,083 |
| Median | $102,019 | $92,174 |
| Interquartile 25% (IQ1) | $94,047 | $81,230 |
| Interquartile 75% (IQ3) | $113,626 | $109,949 |
| Interquartile Range (IQR) | $19,580 | $28,718 |
| Standard Deviation (Sample) | $22,846 | $23,232 |
| Standard Deviation (Population) | $22,677 | $23,020 |
Similar Demographics by Median Family Income
Demographics Similar to Immigrants from Sierra Leone by Median Family Income
In terms of median family income, the demographic groups most similar to Immigrants from Sierra Leone are Costa Rican ($103,989, a difference of 0.0%), Sierra Leonean ($103,859, a difference of 0.13%), Slovak ($103,729, a difference of 0.25%), Icelander ($104,282, a difference of 0.28%), and Scottish ($104,288, a difference of 0.29%).
| Demographics | Rating | Rank | Median Family Income |
| Native Hawaiians | 75.8 /100 | #155 | Good $104,910 |
| Basques | 74.4 /100 | #156 | Good $104,760 |
| Moroccans | 71.6 /100 | #157 | Good $104,488 |
| Scandinavians | 70.8 /100 | #158 | Good $104,410 |
| Swiss | 70.7 /100 | #159 | Good $104,396 |
| Scottish | 69.5 /100 | #160 | Good $104,288 |
| Icelanders | 69.4 /100 | #161 | Good $104,282 |
| Immigrants | Sierra Leone | 66.2 /100 | #162 | Good $103,990 |
| Costa Ricans | 66.2 /100 | #163 | Good $103,989 |
| Sierra Leoneans | 64.7 /100 | #164 | Good $103,859 |
| Slovaks | 63.1 /100 | #165 | Good $103,729 |
| English | 62.6 /100 | #166 | Good $103,684 |
| South American Indians | 61.9 /100 | #167 | Good $103,624 |
| Immigrants | Peru | 60.8 /100 | #168 | Good $103,534 |
| Czechoslovakians | 57.6 /100 | #169 | Average $103,273 |
Demographics Similar to Immigrants from Grenada by Median Family Income
In terms of median family income, the demographic groups most similar to Immigrants from Grenada are Immigrants from Jamaica ($89,268, a difference of 0.020%), Immigrants from Zaire ($89,285, a difference of 0.040%), Immigrants from Belize ($89,197, a difference of 0.060%), British West Indian ($88,987, a difference of 0.29%), and Blackfeet ($88,717, a difference of 0.60%).
| Demographics | Rating | Rank | Median Family Income |
| Iroquois | 0.2 /100 | #271 | Tragic $90,543 |
| Immigrants | Liberia | 0.2 /100 | #272 | Tragic $90,450 |
| Immigrants | Micronesia | 0.2 /100 | #273 | Tragic $90,345 |
| Spanish Americans | 0.2 /100 | #274 | Tragic $90,322 |
| Immigrants | St. Vincent and the Grenadines | 0.2 /100 | #275 | Tragic $90,094 |
| Immigrants | Zaire | 0.1 /100 | #276 | Tragic $89,285 |
| Immigrants | Jamaica | 0.1 /100 | #277 | Tragic $89,268 |
| Immigrants | Grenada | 0.1 /100 | #278 | Tragic $89,249 |
| Immigrants | Belize | 0.1 /100 | #279 | Tragic $89,197 |
| British West Indians | 0.1 /100 | #280 | Tragic $88,987 |
| Blackfeet | 0.1 /100 | #281 | Tragic $88,717 |
| Comanche | 0.1 /100 | #282 | Tragic $88,556 |
| Bangladeshis | 0.1 /100 | #283 | Tragic $88,358 |
| Indonesians | 0.1 /100 | #284 | Tragic $88,301 |
| Guatemalans | 0.1 /100 | #285 | Tragic $88,295 |