Basque vs Immigrants from Grenada Median Family Income
COMPARE
Basque
Immigrants from Grenada
Median Family Income
Median Family Income Comparison
Basques
Immigrants from Grenada
$104,760
MEDIAN FAMILY INCOME
74.4/ 100
METRIC RATING
156th/ 347
METRIC RANK
$89,249
MEDIAN FAMILY INCOME
0.1/ 100
METRIC RATING
278th/ 347
METRIC RANK
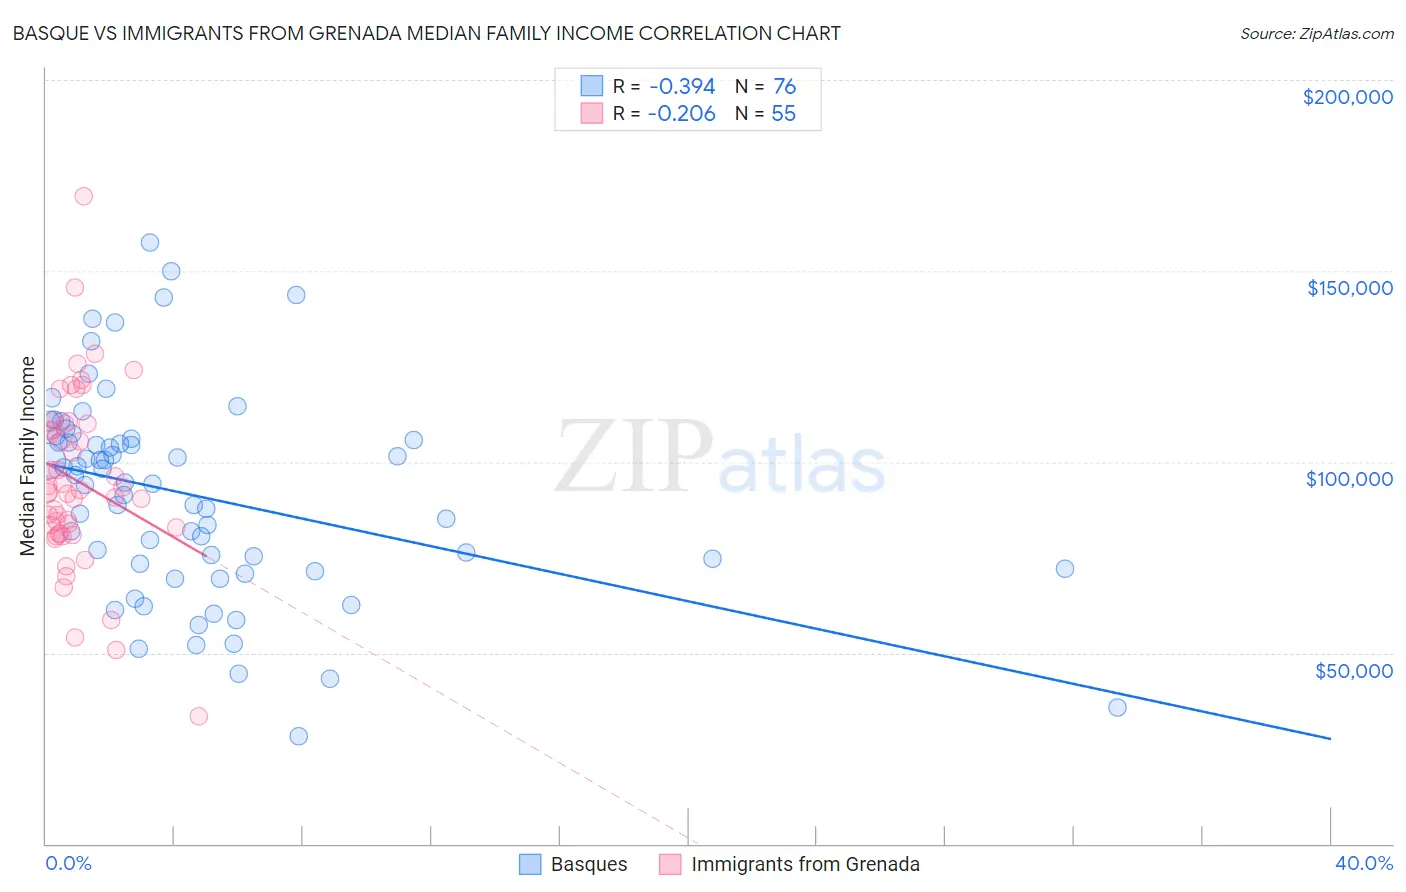
Basque vs Immigrants from Grenada Median Family Income Correlation Chart
The statistical analysis conducted on geographies consisting of 165,742,125 people shows a mild negative correlation between the proportion of Basques and median family income in the United States with a correlation coefficient (R) of -0.394 and weighted average of $104,760. Similarly, the statistical analysis conducted on geographies consisting of 67,181,093 people shows a weak negative correlation between the proportion of Immigrants from Grenada and median family income in the United States with a correlation coefficient (R) of -0.206 and weighted average of $89,249, a difference of 17.4%.
Median Family Income Correlation Summary
| Measurement | Basque | Immigrants from Grenada |
| Minimum | $28,036 | $33,250 |
| Maximum | $157,351 | $169,583 |
| Range | $129,315 | $136,333 |
| Mean | $91,256 | $95,083 |
| Median | $94,457 | $92,174 |
| Interquartile 25% (IQ1) | $72,725 | $81,230 |
| Interquartile 75% (IQ3) | $105,919 | $109,949 |
| Interquartile Range (IQR) | $33,194 | $28,718 |
| Standard Deviation (Sample) | $26,783 | $23,232 |
| Standard Deviation (Population) | $26,606 | $23,020 |
Similar Demographics by Median Family Income
Demographics Similar to Basques by Median Family Income
In terms of median family income, the demographic groups most similar to Basques are Native Hawaiian ($104,910, a difference of 0.14%), Immigrants from Nepal ($104,966, a difference of 0.20%), Moroccan ($104,488, a difference of 0.26%), Scandinavian ($104,410, a difference of 0.34%), and Swiss ($104,396, a difference of 0.35%).
| Demographics | Rating | Rank | Median Family Income |
| Immigrants | Germany | 80.9 /100 | #149 | Excellent $105,507 |
| Irish | 80.5 /100 | #150 | Excellent $105,453 |
| Peruvians | 80.4 /100 | #151 | Excellent $105,444 |
| Immigrants | Albania | 79.1 /100 | #152 | Good $105,285 |
| Slavs | 77.9 /100 | #153 | Good $105,144 |
| Immigrants | Nepal | 76.3 /100 | #154 | Good $104,966 |
| Native Hawaiians | 75.8 /100 | #155 | Good $104,910 |
| Basques | 74.4 /100 | #156 | Good $104,760 |
| Moroccans | 71.6 /100 | #157 | Good $104,488 |
| Scandinavians | 70.8 /100 | #158 | Good $104,410 |
| Swiss | 70.7 /100 | #159 | Good $104,396 |
| Scottish | 69.5 /100 | #160 | Good $104,288 |
| Icelanders | 69.4 /100 | #161 | Good $104,282 |
| Immigrants | Sierra Leone | 66.2 /100 | #162 | Good $103,990 |
| Costa Ricans | 66.2 /100 | #163 | Good $103,989 |
Demographics Similar to Immigrants from Grenada by Median Family Income
In terms of median family income, the demographic groups most similar to Immigrants from Grenada are Immigrants from Jamaica ($89,268, a difference of 0.020%), Immigrants from Zaire ($89,285, a difference of 0.040%), Immigrants from Belize ($89,197, a difference of 0.060%), British West Indian ($88,987, a difference of 0.29%), and Blackfeet ($88,717, a difference of 0.60%).
| Demographics | Rating | Rank | Median Family Income |
| Iroquois | 0.2 /100 | #271 | Tragic $90,543 |
| Immigrants | Liberia | 0.2 /100 | #272 | Tragic $90,450 |
| Immigrants | Micronesia | 0.2 /100 | #273 | Tragic $90,345 |
| Spanish Americans | 0.2 /100 | #274 | Tragic $90,322 |
| Immigrants | St. Vincent and the Grenadines | 0.2 /100 | #275 | Tragic $90,094 |
| Immigrants | Zaire | 0.1 /100 | #276 | Tragic $89,285 |
| Immigrants | Jamaica | 0.1 /100 | #277 | Tragic $89,268 |
| Immigrants | Grenada | 0.1 /100 | #278 | Tragic $89,249 |
| Immigrants | Belize | 0.1 /100 | #279 | Tragic $89,197 |
| British West Indians | 0.1 /100 | #280 | Tragic $88,987 |
| Blackfeet | 0.1 /100 | #281 | Tragic $88,717 |
| Comanche | 0.1 /100 | #282 | Tragic $88,556 |
| Bangladeshis | 0.1 /100 | #283 | Tragic $88,358 |
| Indonesians | 0.1 /100 | #284 | Tragic $88,301 |
| Guatemalans | 0.1 /100 | #285 | Tragic $88,295 |