Blackfeet vs Haitian Single Male Poverty
COMPARE
Blackfeet
Haitian
Single Male Poverty
Single Male Poverty Comparison
Blackfeet
Haitians
15.5%
SINGLE MALE POVERTY
0.0/ 100
METRIC RATING
305th/ 347
METRIC RANK
13.2%
SINGLE MALE POVERTY
7.0/ 100
METRIC RATING
227th/ 347
METRIC RANK
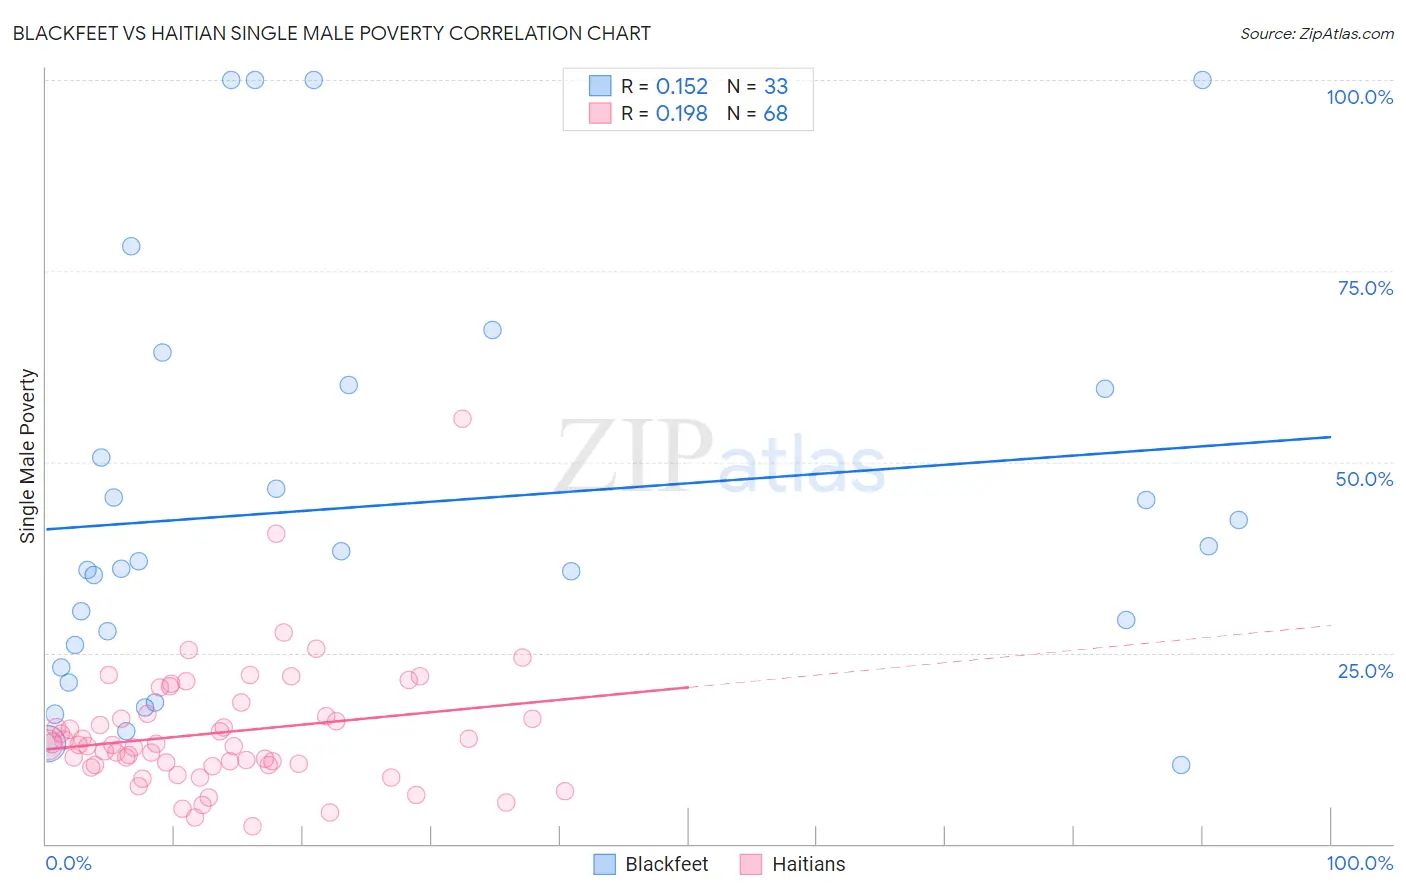
Blackfeet vs Haitian Single Male Poverty Correlation Chart
The statistical analysis conducted on geographies consisting of 285,257,695 people shows a poor positive correlation between the proportion of Blackfeet and poverty level among single males in the United States with a correlation coefficient (R) of 0.152 and weighted average of 15.5%. Similarly, the statistical analysis conducted on geographies consisting of 262,577,789 people shows a poor positive correlation between the proportion of Haitians and poverty level among single males in the United States with a correlation coefficient (R) of 0.198 and weighted average of 13.2%, a difference of 17.1%.
Single Male Poverty Correlation Summary
| Measurement | Blackfeet | Haitian |
| Minimum | 10.3% | 2.3% |
| Maximum | 100.0% | 55.7% |
| Range | 89.7% | 53.4% |
| Mean | 44.4% | 14.5% |
| Median | 37.0% | 12.9% |
| Interquartile 25% (IQ1) | 24.6% | 10.3% |
| Interquartile 75% (IQ3) | 59.8% | 16.9% |
| Interquartile Range (IQR) | 35.2% | 6.6% |
| Standard Deviation (Sample) | 26.6% | 8.3% |
| Standard Deviation (Population) | 26.1% | 8.2% |
Similar Demographics by Single Male Poverty
Demographics Similar to Blackfeet by Single Male Poverty
In terms of single male poverty, the demographic groups most similar to Blackfeet are Pennsylvania German (15.6%, a difference of 0.43%), Alaska Native (15.4%, a difference of 0.53%), Aleut (15.4%, a difference of 0.64%), Ute (15.7%, a difference of 1.2%), and Alsatian (15.2%, a difference of 1.7%).
| Demographics | Rating | Rank | Single Male Poverty |
| French American Indians | 0.0 /100 | #298 | Tragic 15.0% |
| Delaware | 0.0 /100 | #299 | Tragic 15.0% |
| Cree | 0.0 /100 | #300 | Tragic 15.1% |
| Dominicans | 0.0 /100 | #301 | Tragic 15.2% |
| Alsatians | 0.0 /100 | #302 | Tragic 15.2% |
| Aleuts | 0.0 /100 | #303 | Tragic 15.4% |
| Alaska Natives | 0.0 /100 | #304 | Tragic 15.4% |
| Blackfeet | 0.0 /100 | #305 | Tragic 15.5% |
| Pennsylvania Germans | 0.0 /100 | #306 | Tragic 15.6% |
| Ute | 0.0 /100 | #307 | Tragic 15.7% |
| Potawatomi | 0.0 /100 | #308 | Tragic 15.8% |
| Americans | 0.0 /100 | #309 | Tragic 15.8% |
| Yakama | 0.0 /100 | #310 | Tragic 15.9% |
| Seminole | 0.0 /100 | #311 | Tragic 16.0% |
| Comanche | 0.0 /100 | #312 | Tragic 16.0% |
Demographics Similar to Haitians by Single Male Poverty
In terms of single male poverty, the demographic groups most similar to Haitians are Lebanese (13.2%, a difference of 0.080%), Jamaican (13.2%, a difference of 0.13%), European (13.3%, a difference of 0.17%), Ghanaian (13.3%, a difference of 0.20%), and Immigrants from Denmark (13.2%, a difference of 0.30%).
| Demographics | Rating | Rank | Single Male Poverty |
| Central Americans | 10.9 /100 | #220 | Poor 13.2% |
| New Zealanders | 10.7 /100 | #221 | Poor 13.2% |
| Immigrants | Western Europe | 10.0 /100 | #222 | Poor 13.2% |
| Immigrants | Azores | 9.3 /100 | #223 | Tragic 13.2% |
| Somalis | 9.1 /100 | #224 | Tragic 13.2% |
| Immigrants | Denmark | 8.7 /100 | #225 | Tragic 13.2% |
| Jamaicans | 7.7 /100 | #226 | Tragic 13.2% |
| Haitians | 7.0 /100 | #227 | Tragic 13.2% |
| Lebanese | 6.6 /100 | #228 | Tragic 13.2% |
| Europeans | 6.2 /100 | #229 | Tragic 13.3% |
| Ghanaians | 6.1 /100 | #230 | Tragic 13.3% |
| Slavs | 5.3 /100 | #231 | Tragic 13.3% |
| Immigrants | Caribbean | 5.0 /100 | #232 | Tragic 13.3% |
| British | 4.0 /100 | #233 | Tragic 13.3% |
| Canadians | 4.0 /100 | #234 | Tragic 13.3% |