Central American Indian vs Slavic Householder Income Ages 25 - 44 years
COMPARE
Central American Indian
Slavic
Householder Income Ages 25 - 44 years
Householder Income Ages 25 - 44 years Comparison
Central American Indians
Slavs
$82,355
HOUSEHOLDER INCOME AGES 25 - 44 YEARS
0.1/ 100
METRIC RATING
282nd/ 347
METRIC RANK
$96,377
HOUSEHOLDER INCOME AGES 25 - 44 YEARS
73.2/ 100
METRIC RATING
154th/ 347
METRIC RANK
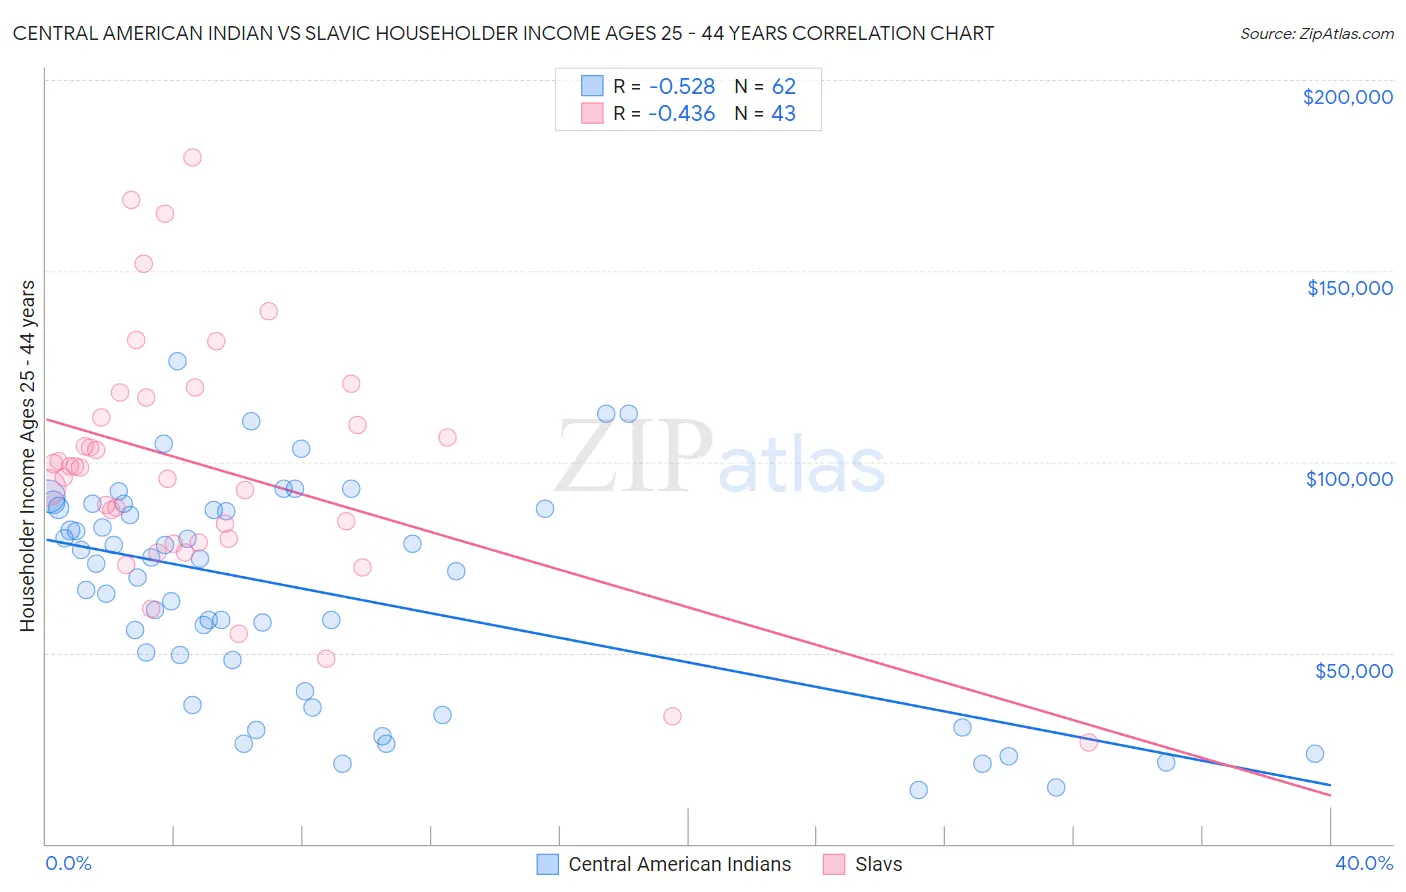
Central American Indian vs Slavic Householder Income Ages 25 - 44 years Correlation Chart
The statistical analysis conducted on geographies consisting of 325,704,457 people shows a substantial negative correlation between the proportion of Central American Indians and household income with householder between the ages 25 and 44 in the United States with a correlation coefficient (R) of -0.528 and weighted average of $82,355. Similarly, the statistical analysis conducted on geographies consisting of 270,306,430 people shows a moderate negative correlation between the proportion of Slavs and household income with householder between the ages 25 and 44 in the United States with a correlation coefficient (R) of -0.436 and weighted average of $96,377, a difference of 17.0%.
Householder Income Ages 25 - 44 years Correlation Summary
| Measurement | Central American Indian | Slavic |
| Minimum | $14,158 | $26,507 |
| Maximum | $126,501 | $179,830 |
| Range | $112,343 | $153,323 |
| Mean | $66,041 | $98,780 |
| Median | $72,238 | $98,521 |
| Interquartile 25% (IQ1) | $39,906 | $78,750 |
| Interquartile 75% (IQ3) | $87,781 | $116,887 |
| Interquartile Range (IQR) | $47,875 | $38,137 |
| Standard Deviation (Sample) | $28,438 | $32,452 |
| Standard Deviation (Population) | $28,208 | $32,072 |
Similar Demographics by Householder Income Ages 25 - 44 years
Demographics Similar to Central American Indians by Householder Income Ages 25 - 44 years
In terms of householder income ages 25 - 44 years, the demographic groups most similar to Central American Indians are Guatemalan ($82,331, a difference of 0.030%), Cajun ($82,393, a difference of 0.050%), Immigrants from Middle Africa ($82,254, a difference of 0.12%), Immigrants from Somalia ($82,188, a difference of 0.20%), and Ute ($82,166, a difference of 0.23%).
| Demographics | Rating | Rank | Householder Income Ages 25 - 44 years |
| Immigrants | Jamaica | 0.2 /100 | #275 | Tragic $83,298 |
| Immigrants | Belize | 0.2 /100 | #276 | Tragic $83,141 |
| Paiute | 0.2 /100 | #277 | Tragic $82,984 |
| Senegalese | 0.2 /100 | #278 | Tragic $82,852 |
| Pima | 0.1 /100 | #279 | Tragic $82,821 |
| Colville | 0.1 /100 | #280 | Tragic $82,604 |
| Cajuns | 0.1 /100 | #281 | Tragic $82,393 |
| Central American Indians | 0.1 /100 | #282 | Tragic $82,355 |
| Guatemalans | 0.1 /100 | #283 | Tragic $82,331 |
| Immigrants | Middle Africa | 0.1 /100 | #284 | Tragic $82,254 |
| Immigrants | Somalia | 0.1 /100 | #285 | Tragic $82,188 |
| Ute | 0.1 /100 | #286 | Tragic $82,166 |
| Immigrants | Latin America | 0.1 /100 | #287 | Tragic $82,166 |
| Comanche | 0.1 /100 | #288 | Tragic $82,152 |
| Shoshone | 0.1 /100 | #289 | Tragic $82,062 |
Demographics Similar to Slavs by Householder Income Ages 25 - 44 years
In terms of householder income ages 25 - 44 years, the demographic groups most similar to Slavs are Slovene ($96,439, a difference of 0.060%), South American Indian ($96,497, a difference of 0.12%), Czech ($96,525, a difference of 0.15%), Moroccan ($96,117, a difference of 0.27%), and Ugandan ($96,667, a difference of 0.30%).
| Demographics | Rating | Rank | Householder Income Ages 25 - 44 years |
| Immigrants | Syria | 77.4 /100 | #147 | Good $96,789 |
| Irish | 76.9 /100 | #148 | Good $96,730 |
| Basques | 76.6 /100 | #149 | Good $96,709 |
| Ugandans | 76.2 /100 | #150 | Good $96,667 |
| Czechs | 74.8 /100 | #151 | Good $96,525 |
| South American Indians | 74.5 /100 | #152 | Good $96,497 |
| Slovenes | 73.9 /100 | #153 | Good $96,439 |
| Slavs | 73.2 /100 | #154 | Good $96,377 |
| Moroccans | 70.3 /100 | #155 | Good $96,117 |
| Immigrants | Germany | 67.9 /100 | #156 | Good $95,913 |
| Immigrants | Uganda | 65.2 /100 | #157 | Good $95,698 |
| Scandinavians | 63.9 /100 | #158 | Good $95,596 |
| Costa Ricans | 63.5 /100 | #159 | Good $95,565 |
| Icelanders | 63.4 /100 | #160 | Good $95,560 |
| Immigrants | Portugal | 62.8 /100 | #161 | Good $95,512 |