Bhutanese vs Jamaican Householder Income Ages 25 - 44 years
COMPARE
Bhutanese
Jamaican
Householder Income Ages 25 - 44 years
Householder Income Ages 25 - 44 years Comparison
Bhutanese
Jamaicans
$109,520
HOUSEHOLDER INCOME AGES 25 - 44 YEARS
100.0/ 100
METRIC RATING
33rd/ 347
METRIC RANK
$83,933
HOUSEHOLDER INCOME AGES 25 - 44 YEARS
0.3/ 100
METRIC RATING
270th/ 347
METRIC RANK
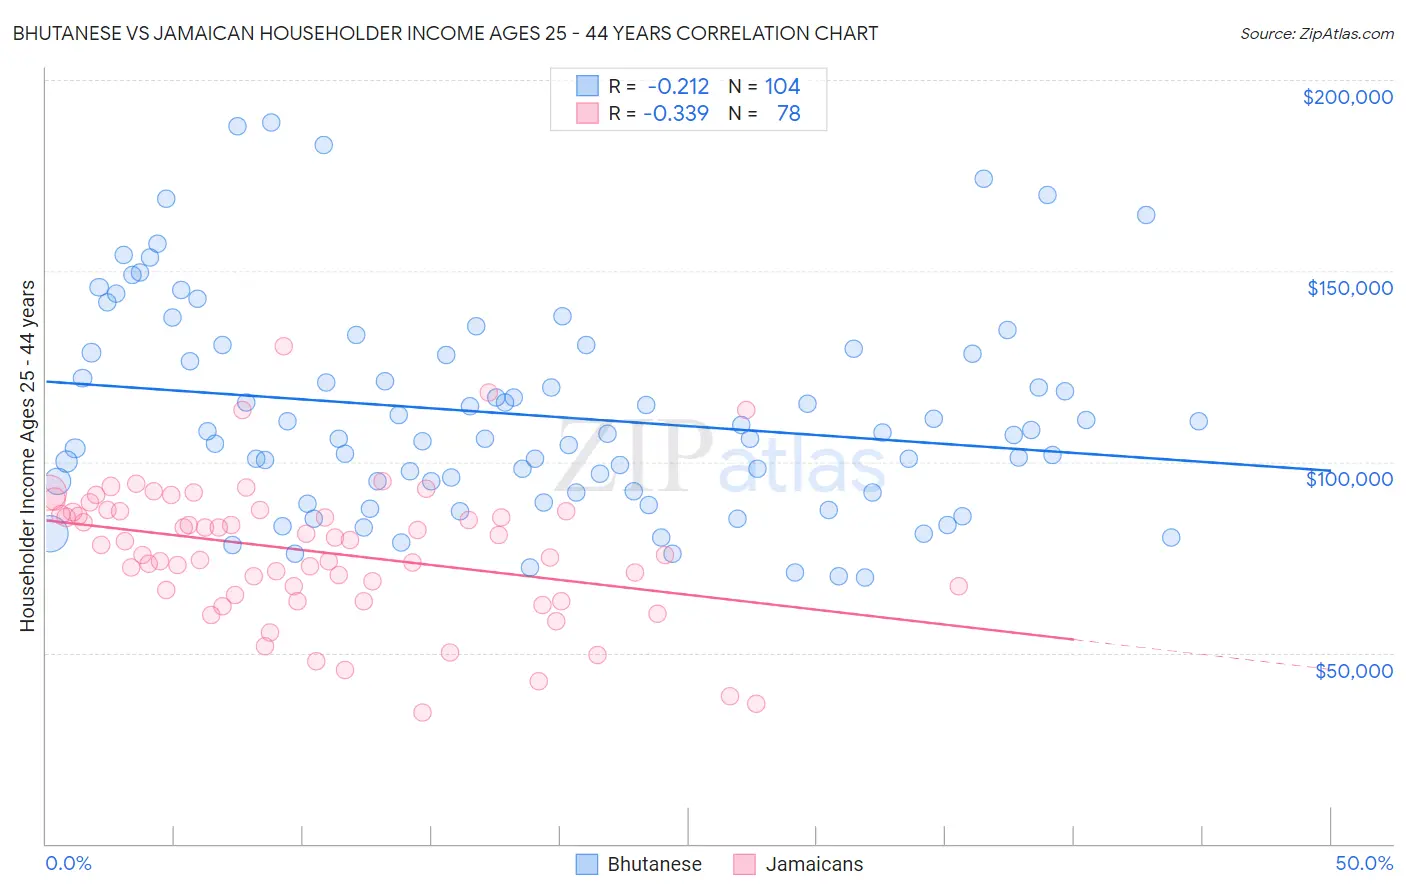
Bhutanese vs Jamaican Householder Income Ages 25 - 44 years Correlation Chart
The statistical analysis conducted on geographies consisting of 454,022,239 people shows a weak negative correlation between the proportion of Bhutanese and household income with householder between the ages 25 and 44 in the United States with a correlation coefficient (R) of -0.212 and weighted average of $109,520. Similarly, the statistical analysis conducted on geographies consisting of 367,030,612 people shows a mild negative correlation between the proportion of Jamaicans and household income with householder between the ages 25 and 44 in the United States with a correlation coefficient (R) of -0.339 and weighted average of $83,933, a difference of 30.5%.
Householder Income Ages 25 - 44 years Correlation Summary
| Measurement | Bhutanese | Jamaican |
| Minimum | $69,864 | $34,529 |
| Maximum | $188,962 | $130,290 |
| Range | $119,098 | $95,761 |
| Mean | $112,280 | $76,521 |
| Median | $107,164 | $78,807 |
| Interquartile 25% (IQ1) | $92,216 | $66,599 |
| Interquartile 75% (IQ3) | $128,400 | $86,908 |
| Interquartile Range (IQR) | $36,183 | $20,309 |
| Standard Deviation (Sample) | $27,356 | $17,827 |
| Standard Deviation (Population) | $27,224 | $17,712 |
Similar Demographics by Householder Income Ages 25 - 44 years
Demographics Similar to Bhutanese by Householder Income Ages 25 - 44 years
In terms of householder income ages 25 - 44 years, the demographic groups most similar to Bhutanese are Bolivian ($109,372, a difference of 0.13%), Immigrants from Sri Lanka ($109,741, a difference of 0.20%), Immigrants from Switzerland ($109,185, a difference of 0.31%), Maltese ($110,064, a difference of 0.50%), and Immigrants from Greece ($110,103, a difference of 0.53%).
| Demographics | Rating | Rank | Householder Income Ages 25 - 44 years |
| Immigrants | Asia | 100.0 /100 | #26 | Exceptional $110,787 |
| Russians | 100.0 /100 | #27 | Exceptional $110,398 |
| Immigrants | Denmark | 100.0 /100 | #28 | Exceptional $110,363 |
| Turks | 100.0 /100 | #29 | Exceptional $110,318 |
| Immigrants | Greece | 100.0 /100 | #30 | Exceptional $110,103 |
| Maltese | 100.0 /100 | #31 | Exceptional $110,064 |
| Immigrants | Sri Lanka | 100.0 /100 | #32 | Exceptional $109,741 |
| Bhutanese | 100.0 /100 | #33 | Exceptional $109,520 |
| Bolivians | 100.0 /100 | #34 | Exceptional $109,372 |
| Immigrants | Switzerland | 100.0 /100 | #35 | Exceptional $109,185 |
| Latvians | 100.0 /100 | #36 | Exceptional $108,926 |
| Immigrants | Russia | 100.0 /100 | #37 | Exceptional $108,751 |
| Soviet Union | 100.0 /100 | #38 | Exceptional $108,457 |
| Immigrants | France | 99.9 /100 | #39 | Exceptional $108,257 |
| Immigrants | Lithuania | 99.9 /100 | #40 | Exceptional $108,149 |
Demographics Similar to Jamaicans by Householder Income Ages 25 - 44 years
In terms of householder income ages 25 - 44 years, the demographic groups most similar to Jamaicans are Spanish American Indian ($84,085, a difference of 0.18%), Somali ($83,752, a difference of 0.22%), Spanish American ($83,722, a difference of 0.25%), Iroquois ($83,682, a difference of 0.30%), and Subsaharan African ($84,235, a difference of 0.36%).
| Demographics | Rating | Rank | Householder Income Ages 25 - 44 years |
| Belizeans | 0.4 /100 | #263 | Tragic $84,534 |
| Osage | 0.4 /100 | #264 | Tragic $84,461 |
| Sudanese | 0.4 /100 | #265 | Tragic $84,401 |
| Immigrants | Cabo Verde | 0.3 /100 | #266 | Tragic $84,304 |
| Hmong | 0.3 /100 | #267 | Tragic $84,258 |
| Sub-Saharan Africans | 0.3 /100 | #268 | Tragic $84,235 |
| Spanish American Indians | 0.3 /100 | #269 | Tragic $84,085 |
| Jamaicans | 0.3 /100 | #270 | Tragic $83,933 |
| Somalis | 0.2 /100 | #271 | Tragic $83,752 |
| Spanish Americans | 0.2 /100 | #272 | Tragic $83,722 |
| Iroquois | 0.2 /100 | #273 | Tragic $83,682 |
| Marshallese | 0.2 /100 | #274 | Tragic $83,575 |
| Immigrants | Jamaica | 0.2 /100 | #275 | Tragic $83,298 |
| Immigrants | Belize | 0.2 /100 | #276 | Tragic $83,141 |
| Paiute | 0.2 /100 | #277 | Tragic $82,984 |