Bhutanese vs Creek Householder Income Ages 25 - 44 years
COMPARE
Bhutanese
Creek
Householder Income Ages 25 - 44 years
Householder Income Ages 25 - 44 years Comparison
Bhutanese
Creek
$109,520
HOUSEHOLDER INCOME AGES 25 - 44 YEARS
100.0/ 100
METRIC RATING
33rd/ 347
METRIC RANK
$74,847
HOUSEHOLDER INCOME AGES 25 - 44 YEARS
0.0/ 100
METRIC RATING
334th/ 347
METRIC RANK
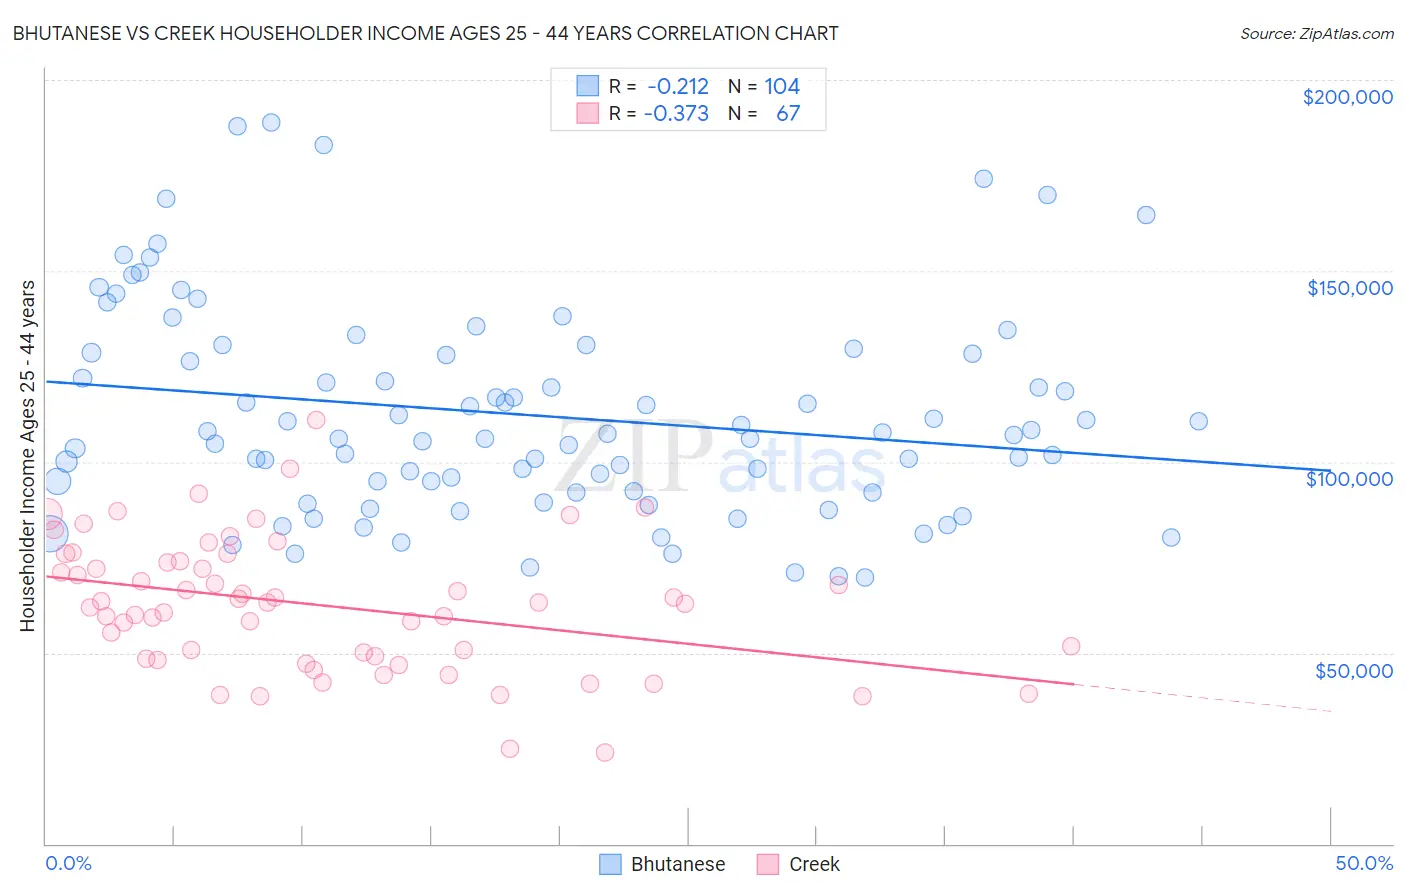
Bhutanese vs Creek Householder Income Ages 25 - 44 years Correlation Chart
The statistical analysis conducted on geographies consisting of 454,022,239 people shows a weak negative correlation between the proportion of Bhutanese and household income with householder between the ages 25 and 44 in the United States with a correlation coefficient (R) of -0.212 and weighted average of $109,520. Similarly, the statistical analysis conducted on geographies consisting of 178,137,913 people shows a mild negative correlation between the proportion of Creek and household income with householder between the ages 25 and 44 in the United States with a correlation coefficient (R) of -0.373 and weighted average of $74,847, a difference of 46.3%.
Householder Income Ages 25 - 44 years Correlation Summary
| Measurement | Bhutanese | Creek |
| Minimum | $69,864 | $23,750 |
| Maximum | $188,962 | $110,938 |
| Range | $119,098 | $87,188 |
| Mean | $112,280 | $62,466 |
| Median | $107,164 | $63,125 |
| Interquartile 25% (IQ1) | $92,216 | $48,423 |
| Interquartile 75% (IQ3) | $128,400 | $74,039 |
| Interquartile Range (IQR) | $36,183 | $25,616 |
| Standard Deviation (Sample) | $27,356 | $17,416 |
| Standard Deviation (Population) | $27,224 | $17,285 |
Similar Demographics by Householder Income Ages 25 - 44 years
Demographics Similar to Bhutanese by Householder Income Ages 25 - 44 years
In terms of householder income ages 25 - 44 years, the demographic groups most similar to Bhutanese are Bolivian ($109,372, a difference of 0.13%), Immigrants from Sri Lanka ($109,741, a difference of 0.20%), Immigrants from Switzerland ($109,185, a difference of 0.31%), Maltese ($110,064, a difference of 0.50%), and Immigrants from Greece ($110,103, a difference of 0.53%).
| Demographics | Rating | Rank | Householder Income Ages 25 - 44 years |
| Immigrants | Asia | 100.0 /100 | #26 | Exceptional $110,787 |
| Russians | 100.0 /100 | #27 | Exceptional $110,398 |
| Immigrants | Denmark | 100.0 /100 | #28 | Exceptional $110,363 |
| Turks | 100.0 /100 | #29 | Exceptional $110,318 |
| Immigrants | Greece | 100.0 /100 | #30 | Exceptional $110,103 |
| Maltese | 100.0 /100 | #31 | Exceptional $110,064 |
| Immigrants | Sri Lanka | 100.0 /100 | #32 | Exceptional $109,741 |
| Bhutanese | 100.0 /100 | #33 | Exceptional $109,520 |
| Bolivians | 100.0 /100 | #34 | Exceptional $109,372 |
| Immigrants | Switzerland | 100.0 /100 | #35 | Exceptional $109,185 |
| Latvians | 100.0 /100 | #36 | Exceptional $108,926 |
| Immigrants | Russia | 100.0 /100 | #37 | Exceptional $108,751 |
| Soviet Union | 100.0 /100 | #38 | Exceptional $108,457 |
| Immigrants | France | 99.9 /100 | #39 | Exceptional $108,257 |
| Immigrants | Lithuania | 99.9 /100 | #40 | Exceptional $108,149 |
Demographics Similar to Creek by Householder Income Ages 25 - 44 years
In terms of householder income ages 25 - 44 years, the demographic groups most similar to Creek are Kiowa ($74,776, a difference of 0.10%), Hopi ($75,002, a difference of 0.21%), Bahamian ($75,395, a difference of 0.73%), Native/Alaskan ($75,647, a difference of 1.1%), and Yup'ik ($73,688, a difference of 1.6%).
| Demographics | Rating | Rank | Householder Income Ages 25 - 44 years |
| Immigrants | Bahamas | 0.0 /100 | #327 | Tragic $76,910 |
| Immigrants | Cuba | 0.0 /100 | #328 | Tragic $76,701 |
| Seminole | 0.0 /100 | #329 | Tragic $76,584 |
| Yakama | 0.0 /100 | #330 | Tragic $76,226 |
| Natives/Alaskans | 0.0 /100 | #331 | Tragic $75,647 |
| Bahamians | 0.0 /100 | #332 | Tragic $75,395 |
| Hopi | 0.0 /100 | #333 | Tragic $75,002 |
| Creek | 0.0 /100 | #334 | Tragic $74,847 |
| Kiowa | 0.0 /100 | #335 | Tragic $74,776 |
| Yup'ik | 0.0 /100 | #336 | Tragic $73,688 |
| Blacks/African Americans | 0.0 /100 | #337 | Tragic $73,370 |
| Immigrants | Yemen | 0.0 /100 | #338 | Tragic $73,043 |
| Yuman | 0.0 /100 | #339 | Tragic $72,956 |
| Immigrants | Congo | 0.0 /100 | #340 | Tragic $72,178 |
| Arapaho | 0.0 /100 | #341 | Tragic $71,697 |