Pakistani vs Kenyan Householder Income Ages 25 - 44 years
COMPARE
Pakistani
Kenyan
Householder Income Ages 25 - 44 years
Householder Income Ages 25 - 44 years Comparison
Pakistanis
Kenyans
$98,401
HOUSEHOLDER INCOME AGES 25 - 44 YEARS
89.3/ 100
METRIC RATING
125th/ 347
METRIC RANK
$91,684
HOUSEHOLDER INCOME AGES 25 - 44 YEARS
16.8/ 100
METRIC RATING
199th/ 347
METRIC RANK
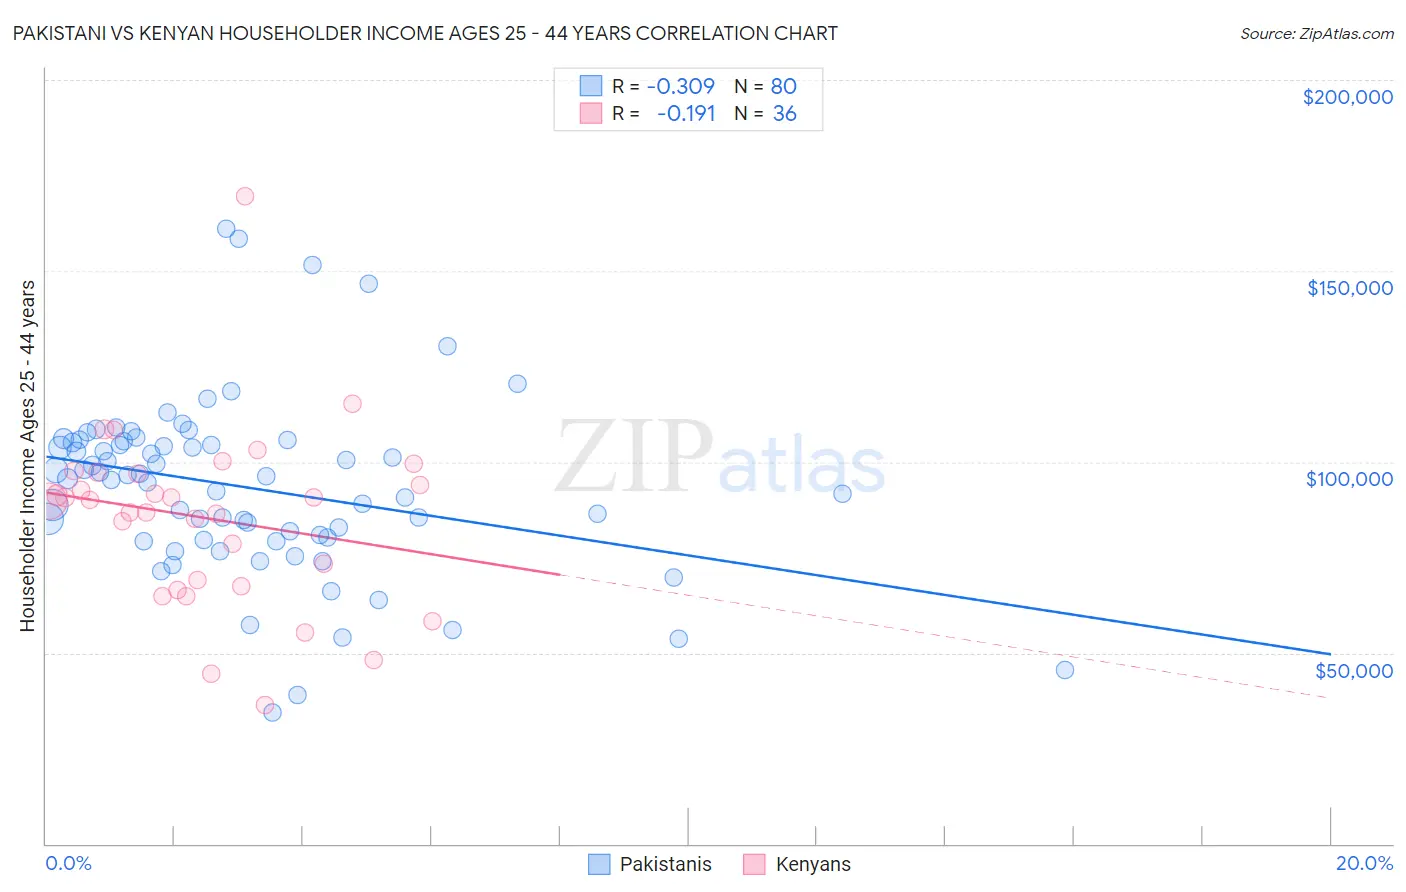
Pakistani vs Kenyan Householder Income Ages 25 - 44 years Correlation Chart
The statistical analysis conducted on geographies consisting of 334,652,075 people shows a mild negative correlation between the proportion of Pakistanis and household income with householder between the ages 25 and 44 in the United States with a correlation coefficient (R) of -0.309 and weighted average of $98,401. Similarly, the statistical analysis conducted on geographies consisting of 168,058,710 people shows a poor negative correlation between the proportion of Kenyans and household income with householder between the ages 25 and 44 in the United States with a correlation coefficient (R) of -0.191 and weighted average of $91,684, a difference of 7.3%.
Householder Income Ages 25 - 44 years Correlation Summary
| Measurement | Pakistani | Kenyan |
| Minimum | $34,363 | $36,414 |
| Maximum | $161,157 | $169,412 |
| Range | $126,794 | $132,998 |
| Mean | $93,256 | $85,374 |
| Median | $95,924 | $89,858 |
| Interquartile 25% (IQ1) | $79,748 | $68,236 |
| Interquartile 75% (IQ3) | $105,308 | $97,027 |
| Interquartile Range (IQR) | $25,561 | $28,791 |
| Standard Deviation (Sample) | $23,370 | $23,657 |
| Standard Deviation (Population) | $23,224 | $23,326 |
Similar Demographics by Householder Income Ages 25 - 44 years
Demographics Similar to Pakistanis by Householder Income Ages 25 - 44 years
In terms of householder income ages 25 - 44 years, the demographic groups most similar to Pakistanis are British ($98,359, a difference of 0.040%), Serbian ($98,320, a difference of 0.080%), European ($98,310, a difference of 0.090%), Brazilian ($98,267, a difference of 0.14%), and Zimbabwean ($98,586, a difference of 0.19%).
| Demographics | Rating | Rank | Householder Income Ages 25 - 44 years |
| Syrians | 92.9 /100 | #118 | Exceptional $99,215 |
| Jordanians | 92.8 /100 | #119 | Exceptional $99,186 |
| Swedes | 92.7 /100 | #120 | Exceptional $99,136 |
| Peruvians | 91.7 /100 | #121 | Exceptional $98,886 |
| Immigrants | Uzbekistan | 91.5 /100 | #122 | Exceptional $98,849 |
| Palestinians | 91.2 /100 | #123 | Exceptional $98,777 |
| Zimbabweans | 90.3 /100 | #124 | Exceptional $98,586 |
| Pakistanis | 89.3 /100 | #125 | Excellent $98,401 |
| British | 89.1 /100 | #126 | Excellent $98,359 |
| Serbians | 88.9 /100 | #127 | Excellent $98,320 |
| Europeans | 88.9 /100 | #128 | Excellent $98,310 |
| Brazilians | 88.6 /100 | #129 | Excellent $98,267 |
| Immigrants | Kuwait | 87.8 /100 | #130 | Excellent $98,122 |
| Immigrants | Albania | 86.6 /100 | #131 | Excellent $97,929 |
| Immigrants | Zimbabwe | 86.3 /100 | #132 | Excellent $97,880 |
Demographics Similar to Kenyans by Householder Income Ages 25 - 44 years
In terms of householder income ages 25 - 44 years, the demographic groups most similar to Kenyans are White/Caucasian ($91,668, a difference of 0.020%), Japanese ($91,624, a difference of 0.070%), Ecuadorian ($91,574, a difference of 0.12%), Immigrants from Cambodia ($91,533, a difference of 0.16%), and Nepalese ($91,498, a difference of 0.20%).
| Demographics | Rating | Rank | Householder Income Ages 25 - 44 years |
| Immigrants | Costa Rica | 28.2 /100 | #192 | Fair $92,876 |
| Samoans | 23.0 /100 | #193 | Fair $92,385 |
| Immigrants | Azores | 22.4 /100 | #194 | Fair $92,322 |
| Celtics | 21.6 /100 | #195 | Fair $92,241 |
| Immigrants | Colombia | 21.3 /100 | #196 | Fair $92,204 |
| Spanish | 21.2 /100 | #197 | Fair $92,200 |
| Vietnamese | 20.2 /100 | #198 | Fair $92,089 |
| Kenyans | 16.8 /100 | #199 | Poor $91,684 |
| Whites/Caucasians | 16.7 /100 | #200 | Poor $91,668 |
| Japanese | 16.4 /100 | #201 | Poor $91,624 |
| Ecuadorians | 16.0 /100 | #202 | Poor $91,574 |
| Immigrants | Cambodia | 15.7 /100 | #203 | Poor $91,533 |
| Nepalese | 15.4 /100 | #204 | Poor $91,498 |
| Immigrants | Eastern Africa | 15.2 /100 | #205 | Poor $91,458 |
| Aleuts | 14.5 /100 | #206 | Poor $91,370 |