Immigrants from England vs Kenyan Householder Income Ages 25 - 44 years
COMPARE
Immigrants from England
Kenyan
Householder Income Ages 25 - 44 years
Householder Income Ages 25 - 44 years Comparison
Immigrants from England
Kenyans
$102,020
HOUSEHOLDER INCOME AGES 25 - 44 YEARS
98.4/ 100
METRIC RATING
93rd/ 347
METRIC RANK
$91,684
HOUSEHOLDER INCOME AGES 25 - 44 YEARS
16.8/ 100
METRIC RATING
199th/ 347
METRIC RANK
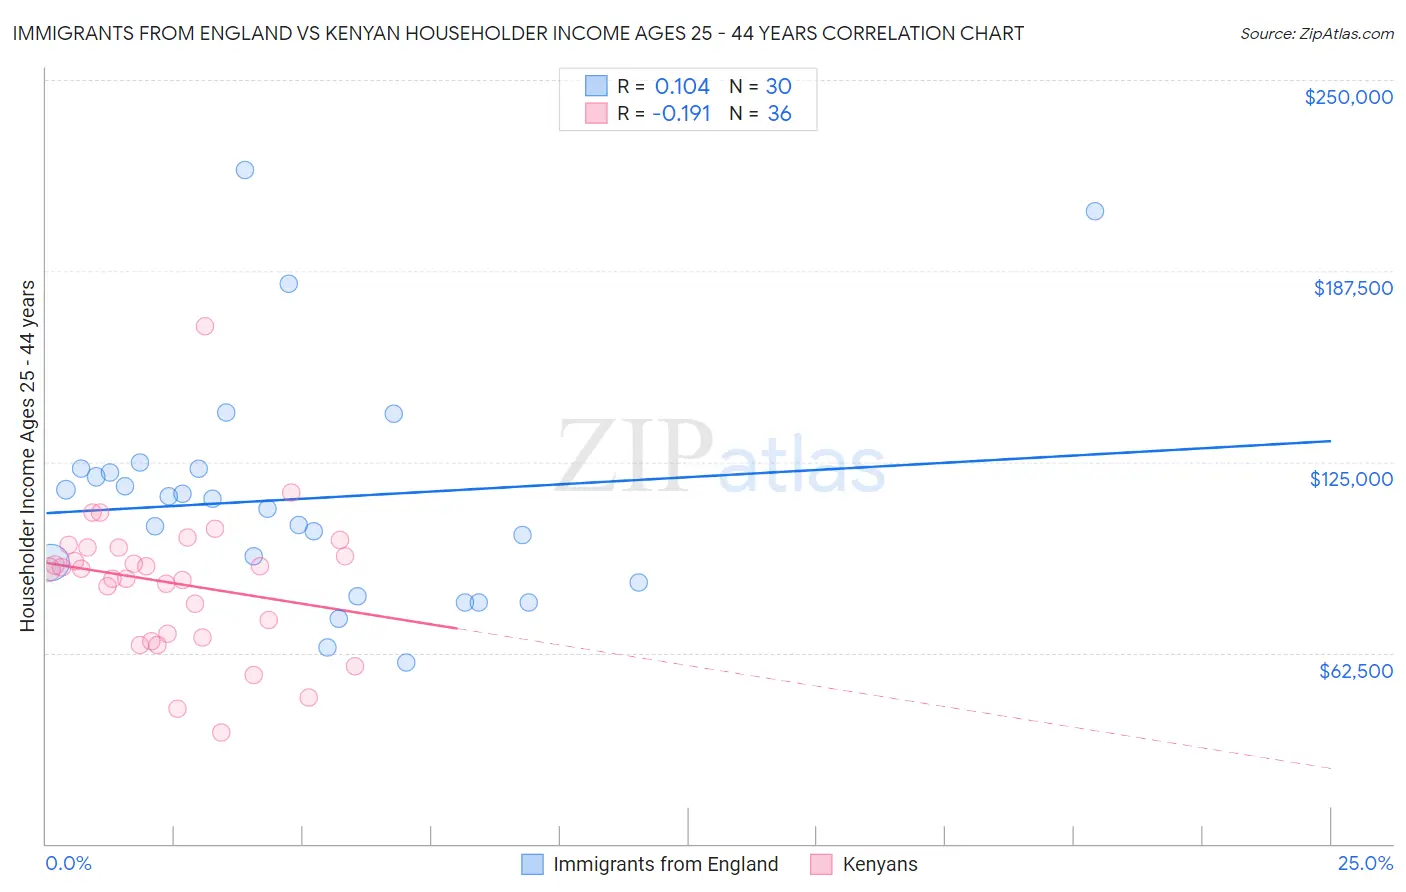
Immigrants from England vs Kenyan Householder Income Ages 25 - 44 years Correlation Chart
The statistical analysis conducted on geographies consisting of 390,728,278 people shows a poor positive correlation between the proportion of Immigrants from England and household income with householder between the ages 25 and 44 in the United States with a correlation coefficient (R) of 0.104 and weighted average of $102,020. Similarly, the statistical analysis conducted on geographies consisting of 168,058,710 people shows a poor negative correlation between the proportion of Kenyans and household income with householder between the ages 25 and 44 in the United States with a correlation coefficient (R) of -0.191 and weighted average of $91,684, a difference of 11.3%.
Householder Income Ages 25 - 44 years Correlation Summary
| Measurement | Immigrants from England | Kenyan |
| Minimum | $59,375 | $36,414 |
| Maximum | $220,451 | $169,412 |
| Range | $161,076 | $132,998 |
| Mean | $112,915 | $85,374 |
| Median | $111,398 | $89,858 |
| Interquartile 25% (IQ1) | $85,313 | $68,236 |
| Interquartile 75% (IQ3) | $122,883 | $97,027 |
| Interquartile Range (IQR) | $37,570 | $28,791 |
| Standard Deviation (Sample) | $37,421 | $23,657 |
| Standard Deviation (Population) | $36,792 | $23,326 |
Similar Demographics by Householder Income Ages 25 - 44 years
Demographics Similar to Immigrants from England by Householder Income Ages 25 - 44 years
In terms of householder income ages 25 - 44 years, the demographic groups most similar to Immigrants from England are Sri Lankan ($101,960, a difference of 0.060%), Assyrian/Chaldean/Syriac ($101,936, a difference of 0.080%), Macedonian ($101,882, a difference of 0.14%), Austrian ($101,842, a difference of 0.17%), and Immigrants from Kazakhstan ($101,727, a difference of 0.29%).
| Demographics | Rating | Rank | Householder Income Ages 25 - 44 years |
| Immigrants | Hungary | 98.9 /100 | #86 | Exceptional $102,655 |
| Immigrants | Western Europe | 98.9 /100 | #87 | Exceptional $102,654 |
| Immigrants | Canada | 98.9 /100 | #88 | Exceptional $102,616 |
| Romanians | 98.8 /100 | #89 | Exceptional $102,544 |
| Ukrainians | 98.8 /100 | #90 | Exceptional $102,451 |
| Croatians | 98.7 /100 | #91 | Exceptional $102,414 |
| Immigrants | North America | 98.7 /100 | #92 | Exceptional $102,407 |
| Immigrants | England | 98.4 /100 | #93 | Exceptional $102,020 |
| Sri Lankans | 98.4 /100 | #94 | Exceptional $101,960 |
| Assyrians/Chaldeans/Syriacs | 98.3 /100 | #95 | Exceptional $101,936 |
| Macedonians | 98.3 /100 | #96 | Exceptional $101,882 |
| Austrians | 98.3 /100 | #97 | Exceptional $101,842 |
| Immigrants | Kazakhstan | 98.1 /100 | #98 | Exceptional $101,727 |
| Taiwanese | 97.9 /100 | #99 | Exceptional $101,492 |
| Immigrants | Argentina | 97.8 /100 | #100 | Exceptional $101,415 |
Demographics Similar to Kenyans by Householder Income Ages 25 - 44 years
In terms of householder income ages 25 - 44 years, the demographic groups most similar to Kenyans are White/Caucasian ($91,668, a difference of 0.020%), Japanese ($91,624, a difference of 0.070%), Ecuadorian ($91,574, a difference of 0.12%), Immigrants from Cambodia ($91,533, a difference of 0.16%), and Nepalese ($91,498, a difference of 0.20%).
| Demographics | Rating | Rank | Householder Income Ages 25 - 44 years |
| Immigrants | Costa Rica | 28.2 /100 | #192 | Fair $92,876 |
| Samoans | 23.0 /100 | #193 | Fair $92,385 |
| Immigrants | Azores | 22.4 /100 | #194 | Fair $92,322 |
| Celtics | 21.6 /100 | #195 | Fair $92,241 |
| Immigrants | Colombia | 21.3 /100 | #196 | Fair $92,204 |
| Spanish | 21.2 /100 | #197 | Fair $92,200 |
| Vietnamese | 20.2 /100 | #198 | Fair $92,089 |
| Kenyans | 16.8 /100 | #199 | Poor $91,684 |
| Whites/Caucasians | 16.7 /100 | #200 | Poor $91,668 |
| Japanese | 16.4 /100 | #201 | Poor $91,624 |
| Ecuadorians | 16.0 /100 | #202 | Poor $91,574 |
| Immigrants | Cambodia | 15.7 /100 | #203 | Poor $91,533 |
| Nepalese | 15.4 /100 | #204 | Poor $91,498 |
| Immigrants | Eastern Africa | 15.2 /100 | #205 | Poor $91,458 |
| Aleuts | 14.5 /100 | #206 | Poor $91,370 |