Bhutanese vs Assyrian/Chaldean/Syriac Householder Income Ages 45 - 64 years
COMPARE
Bhutanese
Assyrian/Chaldean/Syriac
Householder Income Ages 45 - 64 years
Householder Income Ages 45 - 64 years Comparison
Bhutanese
Assyrians/Chaldeans/Syriacs
$117,750
HOUSEHOLDER INCOME AGES 45 - 64 YEARS
100.0/ 100
METRIC RATING
29th/ 347
METRIC RANK
$110,201
HOUSEHOLDER INCOME AGES 45 - 64 YEARS
99.3/ 100
METRIC RATING
72nd/ 347
METRIC RANK
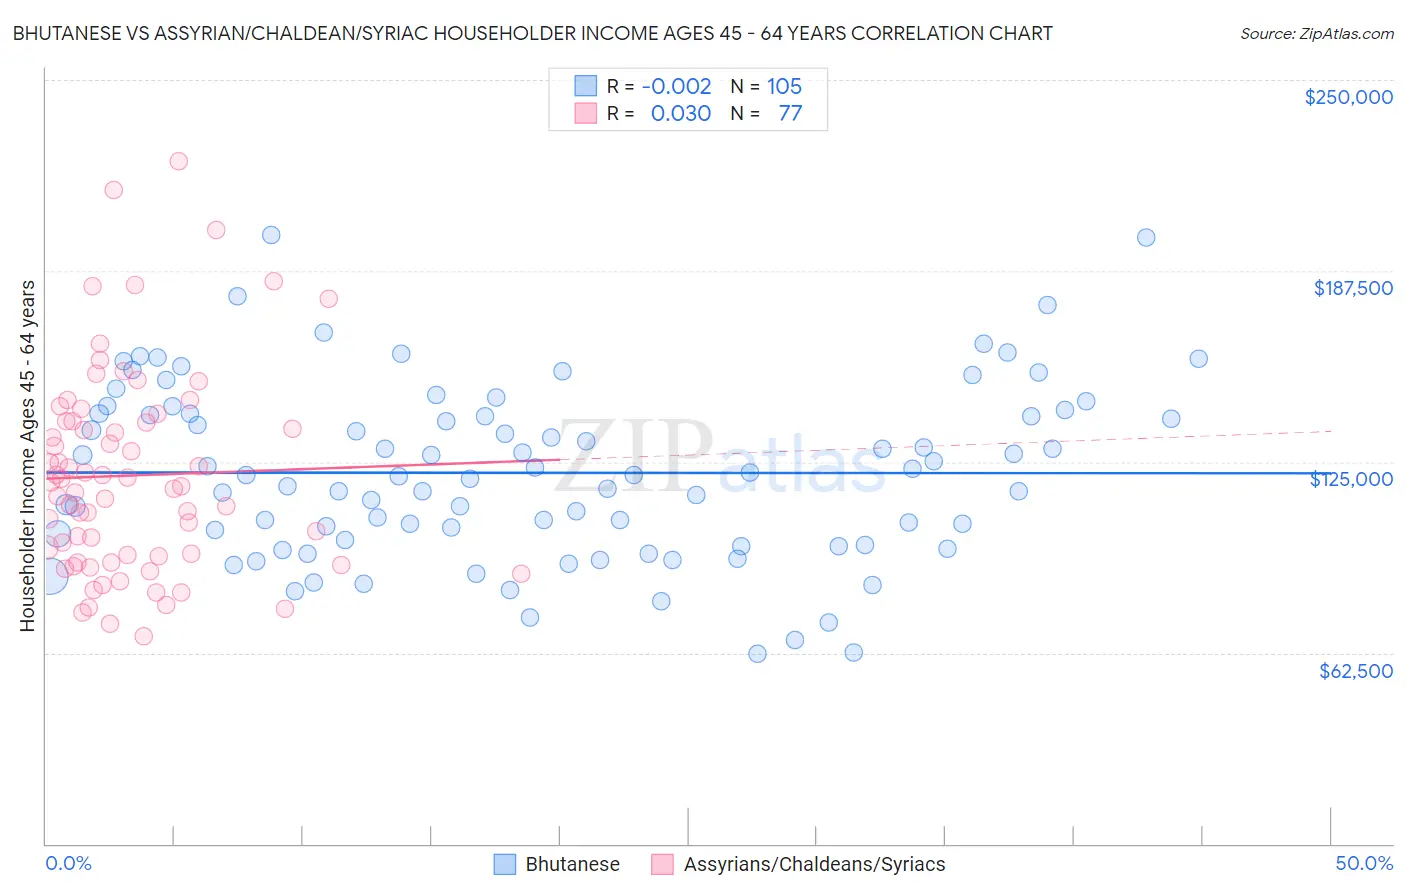
Bhutanese vs Assyrian/Chaldean/Syriac Householder Income Ages 45 - 64 years Correlation Chart
The statistical analysis conducted on geographies consisting of 454,365,624 people shows no correlation between the proportion of Bhutanese and household income with householder between the ages 45 and 64 in the United States with a correlation coefficient (R) of -0.002 and weighted average of $117,750. Similarly, the statistical analysis conducted on geographies consisting of 110,244,252 people shows no correlation between the proportion of Assyrians/Chaldeans/Syriacs and household income with householder between the ages 45 and 64 in the United States with a correlation coefficient (R) of 0.030 and weighted average of $110,201, a difference of 6.9%.
Householder Income Ages 45 - 64 years Correlation Summary
| Measurement | Bhutanese | Assyrian/Chaldean/Syriac |
| Minimum | $62,115 | $67,992 |
| Maximum | $199,389 | $223,409 |
| Range | $137,274 | $155,417 |
| Mean | $121,425 | $120,547 |
| Median | $120,522 | $117,054 |
| Interquartile 25% (IQ1) | $98,623 | $93,085 |
| Interquartile 75% (IQ3) | $140,769 | $138,155 |
| Interquartile Range (IQR) | $42,146 | $45,070 |
| Standard Deviation (Sample) | $28,538 | $33,489 |
| Standard Deviation (Population) | $28,402 | $33,271 |
Similar Demographics by Householder Income Ages 45 - 64 years
Demographics Similar to Bhutanese by Householder Income Ages 45 - 64 years
In terms of householder income ages 45 - 64 years, the demographic groups most similar to Bhutanese are Immigrants from Bolivia ($117,731, a difference of 0.020%), Turkish ($117,814, a difference of 0.050%), Immigrants from Northern Europe ($117,930, a difference of 0.15%), Immigrants from Sweden ($118,318, a difference of 0.48%), and Asian ($118,426, a difference of 0.57%).
| Demographics | Rating | Rank | Householder Income Ages 45 - 64 years |
| Immigrants | Belgium | 100.0 /100 | #22 | Exceptional $118,932 |
| Bolivians | 100.0 /100 | #23 | Exceptional $118,871 |
| Immigrants | Japan | 100.0 /100 | #24 | Exceptional $118,498 |
| Asians | 100.0 /100 | #25 | Exceptional $118,426 |
| Immigrants | Sweden | 100.0 /100 | #26 | Exceptional $118,318 |
| Immigrants | Northern Europe | 100.0 /100 | #27 | Exceptional $117,930 |
| Turks | 100.0 /100 | #28 | Exceptional $117,814 |
| Bhutanese | 100.0 /100 | #29 | Exceptional $117,750 |
| Immigrants | Bolivia | 100.0 /100 | #30 | Exceptional $117,731 |
| Immigrants | Asia | 100.0 /100 | #31 | Exceptional $116,566 |
| Russians | 100.0 /100 | #32 | Exceptional $116,328 |
| Chinese | 100.0 /100 | #33 | Exceptional $116,156 |
| Immigrants | Denmark | 100.0 /100 | #34 | Exceptional $116,000 |
| Latvians | 100.0 /100 | #35 | Exceptional $115,957 |
| Immigrants | Switzerland | 100.0 /100 | #36 | Exceptional $115,934 |
Demographics Similar to Assyrians/Chaldeans/Syriacs by Householder Income Ages 45 - 64 years
In terms of householder income ages 45 - 64 years, the demographic groups most similar to Assyrians/Chaldeans/Syriacs are Italian ($110,224, a difference of 0.020%), Argentinean ($110,103, a difference of 0.090%), Korean ($110,334, a difference of 0.12%), Immigrants from Italy ($110,434, a difference of 0.21%), and Immigrants from Egypt ($109,941, a difference of 0.24%).
| Demographics | Rating | Rank | Householder Income Ages 45 - 64 years |
| Immigrants | Belarus | 99.6 /100 | #65 | Exceptional $111,430 |
| New Zealanders | 99.6 /100 | #66 | Exceptional $111,286 |
| Laotians | 99.5 /100 | #67 | Exceptional $111,051 |
| Immigrants | Romania | 99.4 /100 | #68 | Exceptional $110,633 |
| Immigrants | Italy | 99.4 /100 | #69 | Exceptional $110,434 |
| Koreans | 99.3 /100 | #70 | Exceptional $110,334 |
| Italians | 99.3 /100 | #71 | Exceptional $110,224 |
| Assyrians/Chaldeans/Syriacs | 99.3 /100 | #72 | Exceptional $110,201 |
| Argentineans | 99.3 /100 | #73 | Exceptional $110,103 |
| Immigrants | Egypt | 99.2 /100 | #74 | Exceptional $109,941 |
| South Africans | 99.1 /100 | #75 | Exceptional $109,719 |
| Paraguayans | 99.0 /100 | #76 | Exceptional $109,447 |
| Immigrants | England | 99.0 /100 | #77 | Exceptional $109,446 |
| Immigrants | Canada | 99.0 /100 | #78 | Exceptional $109,402 |
| Immigrants | Bulgaria | 98.9 /100 | #79 | Exceptional $109,379 |