Afghan vs Immigrants from China Householder Income Ages 45 - 64 years
COMPARE
Afghan
Immigrants from China
Householder Income Ages 45 - 64 years
Householder Income Ages 45 - 64 years Comparison
Afghans
Immigrants from China
$112,676
HOUSEHOLDER INCOME AGES 45 - 64 YEARS
99.8/ 100
METRIC RATING
53rd/ 347
METRIC RANK
$122,178
HOUSEHOLDER INCOME AGES 45 - 64 YEARS
100.0/ 100
METRIC RATING
16th/ 347
METRIC RANK
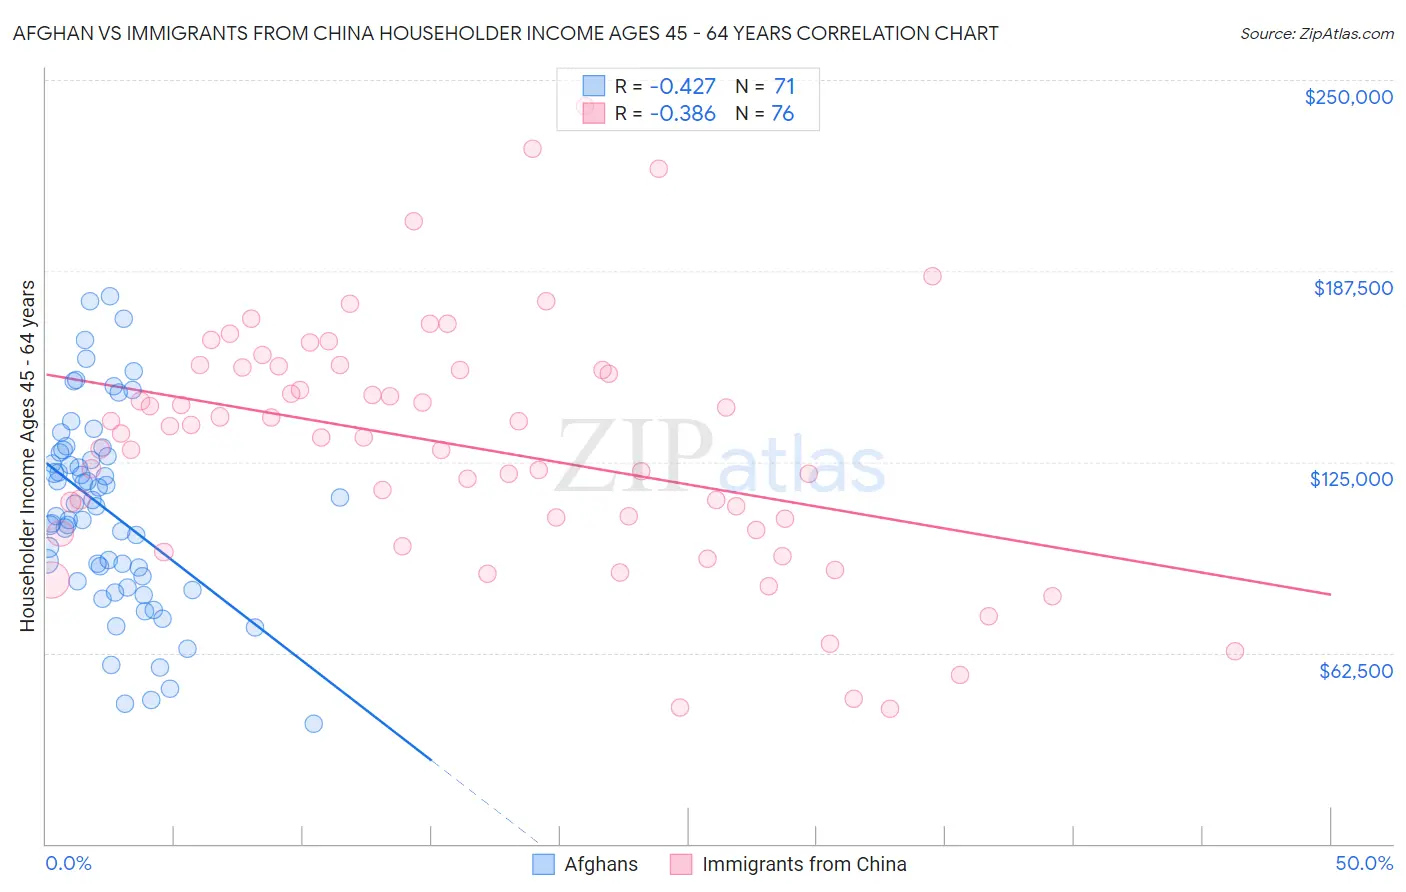
Afghan vs Immigrants from China Householder Income Ages 45 - 64 years Correlation Chart
The statistical analysis conducted on geographies consisting of 148,795,333 people shows a moderate negative correlation between the proportion of Afghans and household income with householder between the ages 45 and 64 in the United States with a correlation coefficient (R) of -0.427 and weighted average of $112,676. Similarly, the statistical analysis conducted on geographies consisting of 455,924,954 people shows a mild negative correlation between the proportion of Immigrants from China and household income with householder between the ages 45 and 64 in the United States with a correlation coefficient (R) of -0.386 and weighted average of $122,178, a difference of 8.4%.
Householder Income Ages 45 - 64 years Correlation Summary
| Measurement | Afghan | Immigrants from China |
| Minimum | $39,280 | $44,167 |
| Maximum | $179,167 | $241,602 |
| Range | $139,887 | $197,435 |
| Mean | $108,848 | $130,137 |
| Median | $110,488 | $133,566 |
| Interquartile 25% (IQ1) | $85,959 | $104,536 |
| Interquartile 75% (IQ3) | $128,039 | $155,654 |
| Interquartile Range (IQR) | $42,080 | $51,118 |
| Standard Deviation (Sample) | $32,099 | $40,272 |
| Standard Deviation (Population) | $31,872 | $40,006 |
Similar Demographics by Householder Income Ages 45 - 64 years
Demographics Similar to Afghans by Householder Income Ages 45 - 64 years
In terms of householder income ages 45 - 64 years, the demographic groups most similar to Afghans are Greek ($112,630, a difference of 0.040%), Immigrants from Malaysia ($112,796, a difference of 0.11%), Lithuanian ($112,484, a difference of 0.17%), Immigrants from South Africa ($112,886, a difference of 0.19%), and Egyptian ($112,256, a difference of 0.37%).
| Demographics | Rating | Rank | Householder Income Ages 45 - 64 years |
| Immigrants | Greece | 99.9 /100 | #46 | Exceptional $113,548 |
| Australians | 99.9 /100 | #47 | Exceptional $113,533 |
| Immigrants | Indonesia | 99.9 /100 | #48 | Exceptional $113,519 |
| Immigrants | Russia | 99.8 /100 | #49 | Exceptional $113,215 |
| Immigrants | Austria | 99.8 /100 | #50 | Exceptional $113,140 |
| Immigrants | South Africa | 99.8 /100 | #51 | Exceptional $112,886 |
| Immigrants | Malaysia | 99.8 /100 | #52 | Exceptional $112,796 |
| Afghans | 99.8 /100 | #53 | Exceptional $112,676 |
| Greeks | 99.8 /100 | #54 | Exceptional $112,630 |
| Lithuanians | 99.8 /100 | #55 | Exceptional $112,484 |
| Egyptians | 99.7 /100 | #56 | Exceptional $112,256 |
| Immigrants | Scotland | 99.7 /100 | #57 | Exceptional $112,175 |
| Soviet Union | 99.7 /100 | #58 | Exceptional $112,008 |
| Immigrants | Europe | 99.7 /100 | #59 | Exceptional $111,984 |
| Immigrants | Netherlands | 99.7 /100 | #60 | Exceptional $111,982 |
Demographics Similar to Immigrants from China by Householder Income Ages 45 - 64 years
In terms of householder income ages 45 - 64 years, the demographic groups most similar to Immigrants from China are Immigrants from Eastern Asia ($122,222, a difference of 0.040%), Indian (Asian) ($122,343, a difference of 0.14%), Immigrants from Ireland ($122,757, a difference of 0.47%), Immigrants from Israel ($122,893, a difference of 0.59%), and Burmese ($121,444, a difference of 0.60%).
| Demographics | Rating | Rank | Householder Income Ages 45 - 64 years |
| Okinawans | 100.0 /100 | #9 | Exceptional $124,796 |
| Immigrants | South Central Asia | 100.0 /100 | #10 | Exceptional $124,188 |
| Cypriots | 100.0 /100 | #11 | Exceptional $123,396 |
| Immigrants | Israel | 100.0 /100 | #12 | Exceptional $122,893 |
| Immigrants | Ireland | 100.0 /100 | #13 | Exceptional $122,757 |
| Indians (Asian) | 100.0 /100 | #14 | Exceptional $122,343 |
| Immigrants | Eastern Asia | 100.0 /100 | #15 | Exceptional $122,222 |
| Immigrants | China | 100.0 /100 | #16 | Exceptional $122,178 |
| Burmese | 100.0 /100 | #17 | Exceptional $121,444 |
| Immigrants | Korea | 100.0 /100 | #18 | Exceptional $121,243 |
| Eastern Europeans | 100.0 /100 | #19 | Exceptional $120,684 |
| Immigrants | Australia | 100.0 /100 | #20 | Exceptional $119,308 |
| Immigrants | Sri Lanka | 100.0 /100 | #21 | Exceptional $119,094 |
| Immigrants | Belgium | 100.0 /100 | #22 | Exceptional $118,932 |
| Bolivians | 100.0 /100 | #23 | Exceptional $118,871 |