South American Indian vs Immigrants from China Householder Income Ages 45 - 64 years
COMPARE
South American Indian
Immigrants from China
Householder Income Ages 45 - 64 years
Householder Income Ages 45 - 64 years Comparison
South American Indians
Immigrants from China
$101,171
HOUSEHOLDER INCOME AGES 45 - 64 YEARS
60.5/ 100
METRIC RATING
168th/ 347
METRIC RANK
$122,178
HOUSEHOLDER INCOME AGES 45 - 64 YEARS
100.0/ 100
METRIC RATING
16th/ 347
METRIC RANK
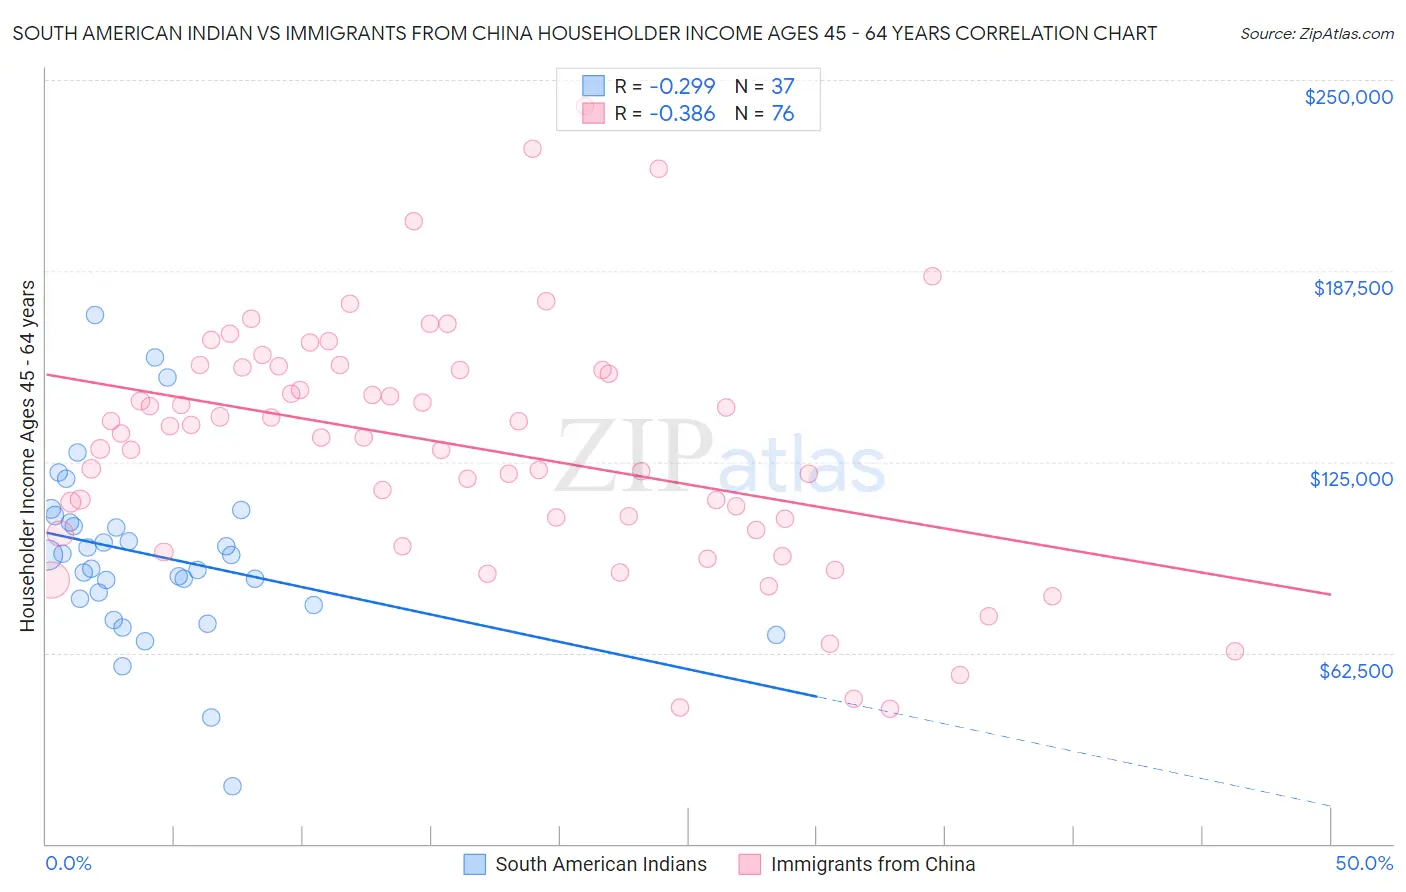
South American Indian vs Immigrants from China Householder Income Ages 45 - 64 years Correlation Chart
The statistical analysis conducted on geographies consisting of 164,498,576 people shows a weak negative correlation between the proportion of South American Indians and household income with householder between the ages 45 and 64 in the United States with a correlation coefficient (R) of -0.299 and weighted average of $101,171. Similarly, the statistical analysis conducted on geographies consisting of 455,924,954 people shows a mild negative correlation between the proportion of Immigrants from China and household income with householder between the ages 45 and 64 in the United States with a correlation coefficient (R) of -0.386 and weighted average of $122,178, a difference of 20.8%.
Householder Income Ages 45 - 64 years Correlation Summary
| Measurement | South American Indian | Immigrants from China |
| Minimum | $18,682 | $44,167 |
| Maximum | $173,033 | $241,602 |
| Range | $154,351 | $197,435 |
| Mean | $94,461 | $130,137 |
| Median | $94,583 | $133,566 |
| Interquartile 25% (IQ1) | $79,132 | $104,536 |
| Interquartile 75% (IQ3) | $106,330 | $155,654 |
| Interquartile Range (IQR) | $27,199 | $51,118 |
| Standard Deviation (Sample) | $29,348 | $40,272 |
| Standard Deviation (Population) | $28,948 | $40,006 |
Similar Demographics by Householder Income Ages 45 - 64 years
Demographics Similar to South American Indians by Householder Income Ages 45 - 64 years
In terms of householder income ages 45 - 64 years, the demographic groups most similar to South American Indians are Guamanian/Chamorro ($101,170, a difference of 0.0%), Slovak ($101,029, a difference of 0.14%), Czechoslovakian ($101,387, a difference of 0.21%), South American ($100,837, a difference of 0.33%), and Samoan ($101,580, a difference of 0.40%).
| Demographics | Rating | Rank | Householder Income Ages 45 - 64 years |
| Immigrants | Nepal | 71.8 /100 | #161 | Good $102,190 |
| Scottish | 71.1 /100 | #162 | Good $102,123 |
| English | 70.1 /100 | #163 | Good $102,021 |
| Immigrants | Morocco | 70.0 /100 | #164 | Good $102,015 |
| Immigrants | Albania | 69.4 /100 | #165 | Good $101,957 |
| Samoans | 65.3 /100 | #166 | Good $101,580 |
| Czechoslovakians | 63.0 /100 | #167 | Good $101,387 |
| South American Indians | 60.5 /100 | #168 | Good $101,171 |
| Guamanians/Chamorros | 60.5 /100 | #169 | Good $101,170 |
| Slovaks | 58.8 /100 | #170 | Average $101,029 |
| South Americans | 56.4 /100 | #171 | Average $100,837 |
| Immigrants | Uzbekistan | 52.5 /100 | #172 | Average $100,523 |
| Alsatians | 51.4 /100 | #173 | Average $100,435 |
| Welsh | 50.0 /100 | #174 | Average $100,322 |
| Germans | 48.8 /100 | #175 | Average $100,224 |
Demographics Similar to Immigrants from China by Householder Income Ages 45 - 64 years
In terms of householder income ages 45 - 64 years, the demographic groups most similar to Immigrants from China are Immigrants from Eastern Asia ($122,222, a difference of 0.040%), Indian (Asian) ($122,343, a difference of 0.14%), Immigrants from Ireland ($122,757, a difference of 0.47%), Immigrants from Israel ($122,893, a difference of 0.59%), and Burmese ($121,444, a difference of 0.60%).
| Demographics | Rating | Rank | Householder Income Ages 45 - 64 years |
| Okinawans | 100.0 /100 | #9 | Exceptional $124,796 |
| Immigrants | South Central Asia | 100.0 /100 | #10 | Exceptional $124,188 |
| Cypriots | 100.0 /100 | #11 | Exceptional $123,396 |
| Immigrants | Israel | 100.0 /100 | #12 | Exceptional $122,893 |
| Immigrants | Ireland | 100.0 /100 | #13 | Exceptional $122,757 |
| Indians (Asian) | 100.0 /100 | #14 | Exceptional $122,343 |
| Immigrants | Eastern Asia | 100.0 /100 | #15 | Exceptional $122,222 |
| Immigrants | China | 100.0 /100 | #16 | Exceptional $122,178 |
| Burmese | 100.0 /100 | #17 | Exceptional $121,444 |
| Immigrants | Korea | 100.0 /100 | #18 | Exceptional $121,243 |
| Eastern Europeans | 100.0 /100 | #19 | Exceptional $120,684 |
| Immigrants | Australia | 100.0 /100 | #20 | Exceptional $119,308 |
| Immigrants | Sri Lanka | 100.0 /100 | #21 | Exceptional $119,094 |
| Immigrants | Belgium | 100.0 /100 | #22 | Exceptional $118,932 |
| Bolivians | 100.0 /100 | #23 | Exceptional $118,871 |