Immigrants from Cameroon vs Immigrants from China Householder Income Ages 45 - 64 years
COMPARE
Immigrants from Cameroon
Immigrants from China
Householder Income Ages 45 - 64 years
Householder Income Ages 45 - 64 years Comparison
Immigrants from Cameroon
Immigrants from China
$100,084
HOUSEHOLDER INCOME AGES 45 - 64 YEARS
47.0/ 100
METRIC RATING
178th/ 347
METRIC RANK
$122,178
HOUSEHOLDER INCOME AGES 45 - 64 YEARS
100.0/ 100
METRIC RATING
16th/ 347
METRIC RANK
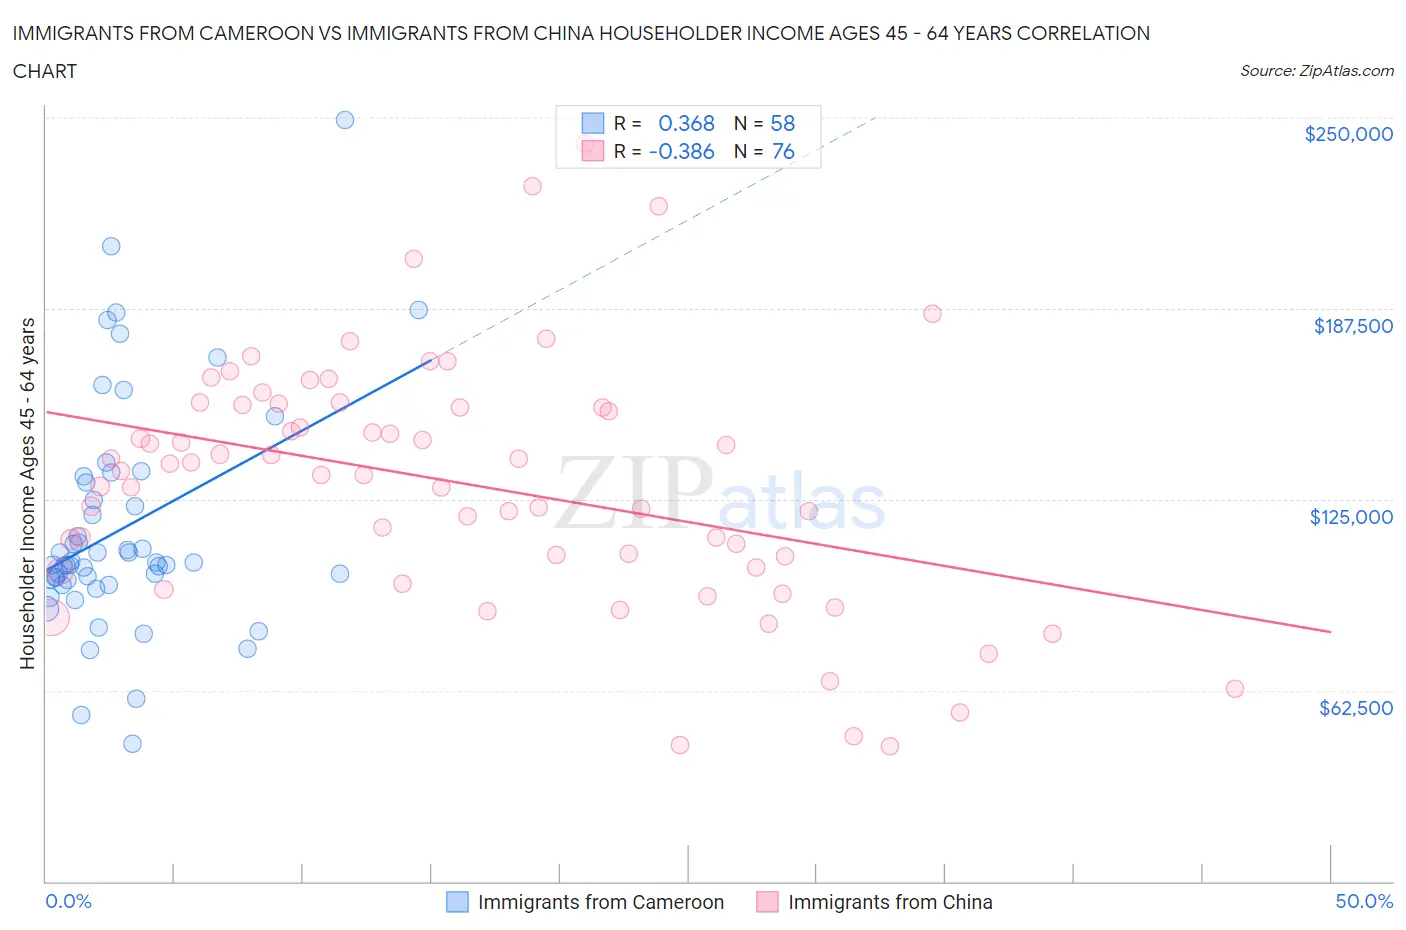
Immigrants from Cameroon vs Immigrants from China Householder Income Ages 45 - 64 years Correlation Chart
The statistical analysis conducted on geographies consisting of 130,699,508 people shows a mild positive correlation between the proportion of Immigrants from Cameroon and household income with householder between the ages 45 and 64 in the United States with a correlation coefficient (R) of 0.368 and weighted average of $100,084. Similarly, the statistical analysis conducted on geographies consisting of 455,924,954 people shows a mild negative correlation between the proportion of Immigrants from China and household income with householder between the ages 45 and 64 in the United States with a correlation coefficient (R) of -0.386 and weighted average of $122,178, a difference of 22.1%.
Householder Income Ages 45 - 64 years Correlation Summary
| Measurement | Immigrants from Cameroon | Immigrants from China |
| Minimum | $45,128 | $44,167 |
| Maximum | $249,250 | $241,602 |
| Range | $204,122 | $197,435 |
| Mean | $115,608 | $130,137 |
| Median | $104,009 | $133,566 |
| Interquartile 25% (IQ1) | $98,639 | $104,536 |
| Interquartile 75% (IQ3) | $130,520 | $155,654 |
| Interquartile Range (IQR) | $31,881 | $51,118 |
| Standard Deviation (Sample) | $37,628 | $40,272 |
| Standard Deviation (Population) | $37,302 | $40,006 |
Similar Demographics by Householder Income Ages 45 - 64 years
Demographics Similar to Immigrants from Cameroon by Householder Income Ages 45 - 64 years
In terms of householder income ages 45 - 64 years, the demographic groups most similar to Immigrants from Cameroon are Belgian ($100,060, a difference of 0.020%), Aleut ($100,052, a difference of 0.030%), Moroccan ($100,138, a difference of 0.050%), Immigrants from Costa Rica ($100,141, a difference of 0.060%), and German ($100,224, a difference of 0.14%).
| Demographics | Rating | Rank | Householder Income Ages 45 - 64 years |
| South Americans | 56.4 /100 | #171 | Average $100,837 |
| Immigrants | Uzbekistan | 52.5 /100 | #172 | Average $100,523 |
| Alsatians | 51.4 /100 | #173 | Average $100,435 |
| Welsh | 50.0 /100 | #174 | Average $100,322 |
| Germans | 48.8 /100 | #175 | Average $100,224 |
| Immigrants | Costa Rica | 47.7 /100 | #176 | Average $100,141 |
| Moroccans | 47.7 /100 | #177 | Average $100,138 |
| Immigrants | Cameroon | 47.0 /100 | #178 | Average $100,084 |
| Belgians | 46.7 /100 | #179 | Average $100,060 |
| Aleuts | 46.6 /100 | #180 | Average $100,052 |
| Immigrants | Immigrants | 45.3 /100 | #181 | Average $99,943 |
| Finns | 44.8 /100 | #182 | Average $99,904 |
| Spaniards | 44.6 /100 | #183 | Average $99,889 |
| French | 43.8 /100 | #184 | Average $99,824 |
| Colombians | 43.2 /100 | #185 | Average $99,772 |
Demographics Similar to Immigrants from China by Householder Income Ages 45 - 64 years
In terms of householder income ages 45 - 64 years, the demographic groups most similar to Immigrants from China are Immigrants from Eastern Asia ($122,222, a difference of 0.040%), Indian (Asian) ($122,343, a difference of 0.14%), Immigrants from Ireland ($122,757, a difference of 0.47%), Immigrants from Israel ($122,893, a difference of 0.59%), and Burmese ($121,444, a difference of 0.60%).
| Demographics | Rating | Rank | Householder Income Ages 45 - 64 years |
| Okinawans | 100.0 /100 | #9 | Exceptional $124,796 |
| Immigrants | South Central Asia | 100.0 /100 | #10 | Exceptional $124,188 |
| Cypriots | 100.0 /100 | #11 | Exceptional $123,396 |
| Immigrants | Israel | 100.0 /100 | #12 | Exceptional $122,893 |
| Immigrants | Ireland | 100.0 /100 | #13 | Exceptional $122,757 |
| Indians (Asian) | 100.0 /100 | #14 | Exceptional $122,343 |
| Immigrants | Eastern Asia | 100.0 /100 | #15 | Exceptional $122,222 |
| Immigrants | China | 100.0 /100 | #16 | Exceptional $122,178 |
| Burmese | 100.0 /100 | #17 | Exceptional $121,444 |
| Immigrants | Korea | 100.0 /100 | #18 | Exceptional $121,243 |
| Eastern Europeans | 100.0 /100 | #19 | Exceptional $120,684 |
| Immigrants | Australia | 100.0 /100 | #20 | Exceptional $119,308 |
| Immigrants | Sri Lanka | 100.0 /100 | #21 | Exceptional $119,094 |
| Immigrants | Belgium | 100.0 /100 | #22 | Exceptional $118,932 |
| Bolivians | 100.0 /100 | #23 | Exceptional $118,871 |