Barbadian vs Immigrants from Belarus Median Earnings
COMPARE
Barbadian
Immigrants from Belarus
Median Earnings
Median Earnings Comparison
Barbadians
Immigrants from Belarus
$45,846
MEDIAN EARNINGS
30.5/ 100
METRIC RATING
197th/ 347
METRIC RANK
$53,043
MEDIAN EARNINGS
100.0/ 100
METRIC RATING
37th/ 347
METRIC RANK
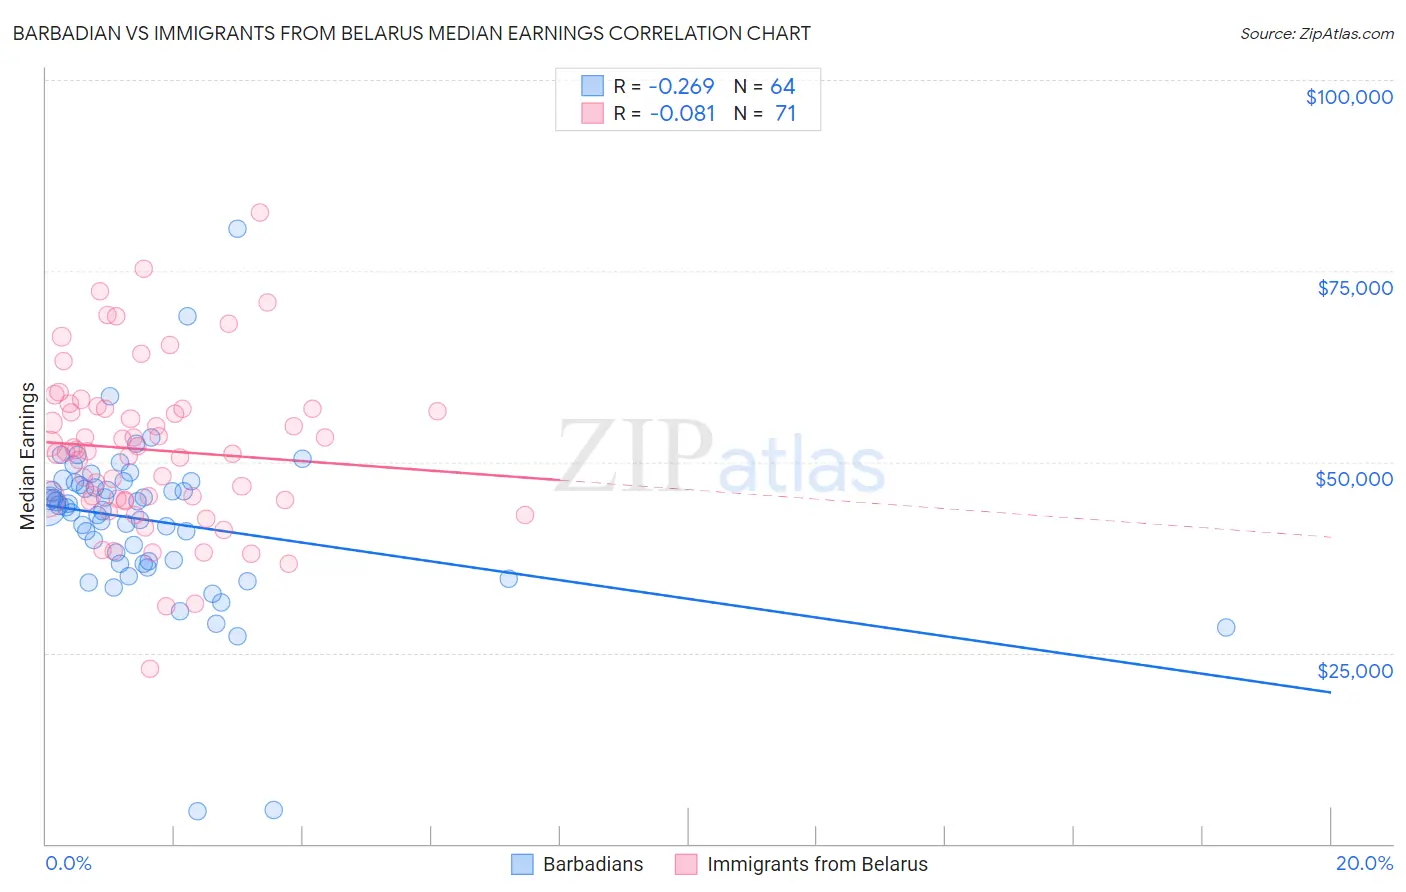
Barbadian vs Immigrants from Belarus Median Earnings Correlation Chart
The statistical analysis conducted on geographies consisting of 141,267,085 people shows a weak negative correlation between the proportion of Barbadians and median earnings in the United States with a correlation coefficient (R) of -0.269 and weighted average of $45,846. Similarly, the statistical analysis conducted on geographies consisting of 150,193,045 people shows a slight negative correlation between the proportion of Immigrants from Belarus and median earnings in the United States with a correlation coefficient (R) of -0.081 and weighted average of $53,043, a difference of 15.7%.
Median Earnings Correlation Summary
| Measurement | Barbadian | Immigrants from Belarus |
| Minimum | $4,250 | $22,866 |
| Maximum | $80,575 | $82,699 |
| Range | $76,325 | $59,833 |
| Mean | $42,285 | $51,554 |
| Median | $44,059 | $51,310 |
| Interquartile 25% (IQ1) | $36,766 | $45,000 |
| Interquartile 75% (IQ3) | $47,124 | $56,946 |
| Interquartile Range (IQR) | $10,358 | $11,946 |
| Standard Deviation (Sample) | $11,063 | $10,748 |
| Standard Deviation (Population) | $10,976 | $10,672 |
Similar Demographics by Median Earnings
Demographics Similar to Barbadians by Median Earnings
In terms of median earnings, the demographic groups most similar to Barbadians are Yugoslavian ($45,846, a difference of 0.0%), Trinidadian and Tobagonian ($45,820, a difference of 0.060%), Immigrants from Barbados ($45,816, a difference of 0.060%), Immigrants from the Azores ($45,812, a difference of 0.070%), and Immigrants from St. Vincent and the Grenadines ($45,908, a difference of 0.14%).
| Demographics | Rating | Rank | Median Earnings |
| French Canadians | 36.1 /100 | #190 | Fair $46,026 |
| Finns | 33.4 /100 | #191 | Fair $45,940 |
| Germans | 33.2 /100 | #192 | Fair $45,935 |
| Guamanians/Chamorros | 33.2 /100 | #193 | Fair $45,933 |
| Immigrants | Costa Rica | 33.0 /100 | #194 | Fair $45,928 |
| Immigrants | St. Vincent and the Grenadines | 32.4 /100 | #195 | Fair $45,908 |
| Yugoslavians | 30.5 /100 | #196 | Fair $45,846 |
| Barbadians | 30.5 /100 | #197 | Fair $45,846 |
| Trinidadians and Tobagonians | 29.7 /100 | #198 | Fair $45,820 |
| Immigrants | Barbados | 29.6 /100 | #199 | Fair $45,816 |
| Immigrants | Azores | 29.5 /100 | #200 | Fair $45,812 |
| Celtics | 27.2 /100 | #201 | Fair $45,732 |
| Immigrants | Trinidad and Tobago | 27.1 /100 | #202 | Fair $45,729 |
| Welsh | 26.6 /100 | #203 | Fair $45,710 |
| Immigrants | Uruguay | 25.9 /100 | #204 | Fair $45,682 |
Demographics Similar to Immigrants from Belarus by Median Earnings
In terms of median earnings, the demographic groups most similar to Immigrants from Belarus are Latvian ($53,001, a difference of 0.080%), Immigrants from Turkey ($52,960, a difference of 0.16%), Israeli ($52,937, a difference of 0.20%), Immigrants from Denmark ($53,186, a difference of 0.27%), and Immigrants from Switzerland ($53,211, a difference of 0.32%).
| Demographics | Rating | Rank | Median Earnings |
| Cambodians | 100.0 /100 | #30 | Exceptional $53,386 |
| Russians | 100.0 /100 | #31 | Exceptional $53,334 |
| Immigrants | Asia | 100.0 /100 | #32 | Exceptional $53,310 |
| Immigrants | Greece | 100.0 /100 | #33 | Exceptional $53,282 |
| Immigrants | Sri Lanka | 100.0 /100 | #34 | Exceptional $53,268 |
| Immigrants | Switzerland | 100.0 /100 | #35 | Exceptional $53,211 |
| Immigrants | Denmark | 100.0 /100 | #36 | Exceptional $53,186 |
| Immigrants | Belarus | 100.0 /100 | #37 | Exceptional $53,043 |
| Latvians | 100.0 /100 | #38 | Exceptional $53,001 |
| Immigrants | Turkey | 100.0 /100 | #39 | Exceptional $52,960 |
| Israelis | 100.0 /100 | #40 | Exceptional $52,937 |
| Immigrants | Lithuania | 100.0 /100 | #41 | Exceptional $52,769 |
| Maltese | 100.0 /100 | #42 | Exceptional $52,526 |
| Immigrants | Malaysia | 100.0 /100 | #43 | Exceptional $52,514 |
| Bulgarians | 100.0 /100 | #44 | Exceptional $52,512 |