Barbadian vs Immigrants from Barbados Median Earnings
COMPARE
Barbadian
Immigrants from Barbados
Median Earnings
Median Earnings Comparison
Barbadians
Immigrants from Barbados
$45,846
MEDIAN EARNINGS
30.5/ 100
METRIC RATING
197th/ 347
METRIC RANK
$45,816
MEDIAN EARNINGS
29.6/ 100
METRIC RATING
199th/ 347
METRIC RANK
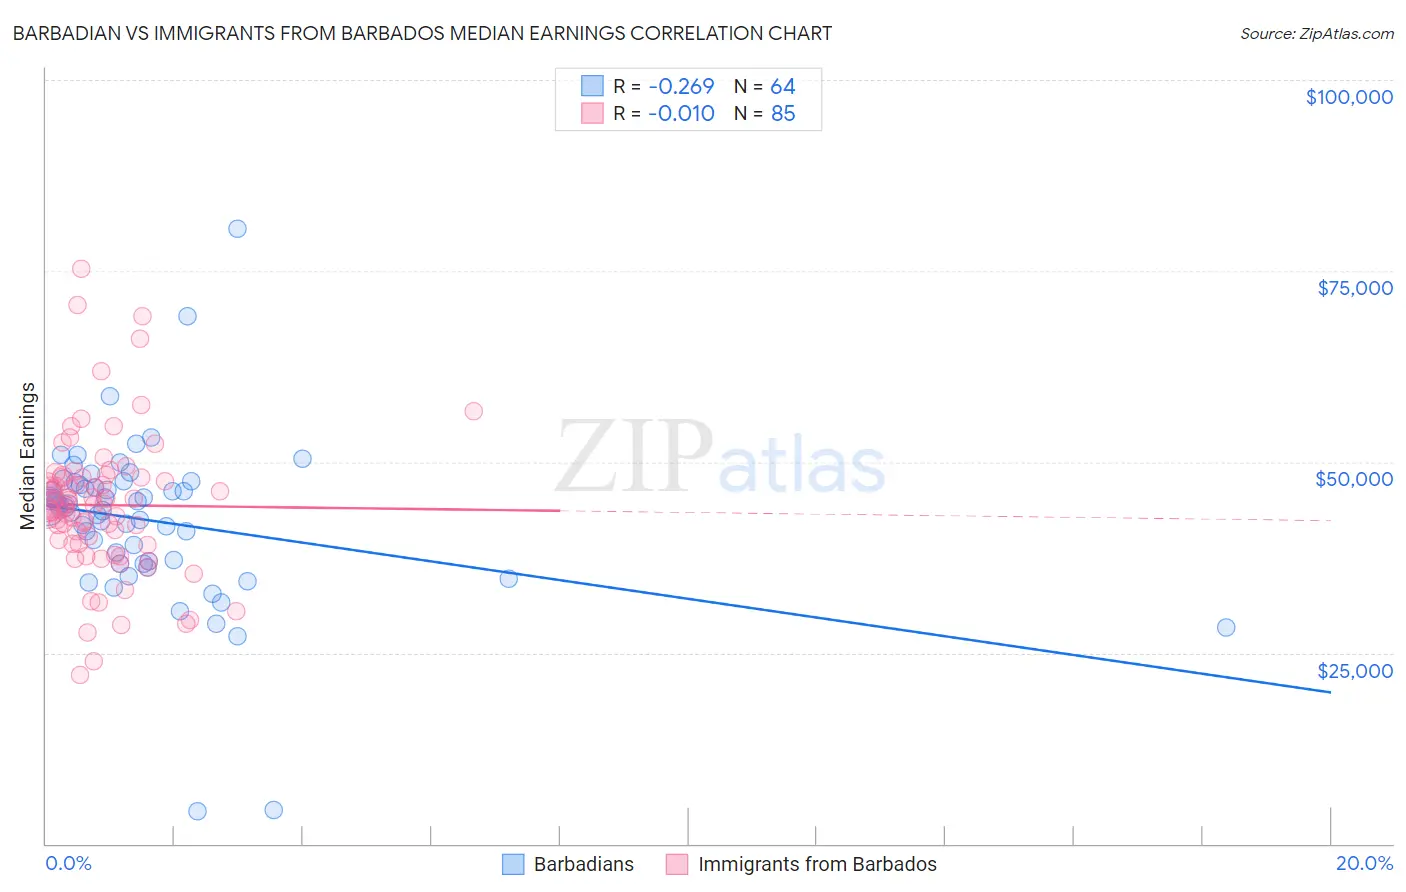
Barbadian vs Immigrants from Barbados Median Earnings Correlation Chart
The statistical analysis conducted on geographies consisting of 141,267,085 people shows a weak negative correlation between the proportion of Barbadians and median earnings in the United States with a correlation coefficient (R) of -0.269 and weighted average of $45,846. Similarly, the statistical analysis conducted on geographies consisting of 112,759,497 people shows no correlation between the proportion of Immigrants from Barbados and median earnings in the United States with a correlation coefficient (R) of -0.010 and weighted average of $45,816, a difference of 0.060%.
Median Earnings Correlation Summary
| Measurement | Barbadian | Immigrants from Barbados |
| Minimum | $4,250 | $22,067 |
| Maximum | $80,575 | $75,335 |
| Range | $76,325 | $53,268 |
| Mean | $42,285 | $44,348 |
| Median | $44,059 | $44,360 |
| Interquartile 25% (IQ1) | $36,766 | $39,293 |
| Interquartile 75% (IQ3) | $47,124 | $47,976 |
| Interquartile Range (IQR) | $10,358 | $8,683 |
| Standard Deviation (Sample) | $11,063 | $9,386 |
| Standard Deviation (Population) | $10,976 | $9,331 |
Demographics Similar to Barbadians and Immigrants from Barbados by Median Earnings
In terms of median earnings, the demographic groups most similar to Barbadians are Yugoslavian ($45,846, a difference of 0.0%), Trinidadian and Tobagonian ($45,820, a difference of 0.060%), Immigrants from the Azores ($45,812, a difference of 0.070%), Immigrants from St. Vincent and the Grenadines ($45,908, a difference of 0.14%), and Immigrants from Costa Rica ($45,928, a difference of 0.18%). Similarly, the demographic groups most similar to Immigrants from Barbados are Trinidadian and Tobagonian ($45,820, a difference of 0.010%), Immigrants from the Azores ($45,812, a difference of 0.010%), Yugoslavian ($45,846, a difference of 0.070%), Celtic ($45,732, a difference of 0.18%), and Immigrants from Trinidad and Tobago ($45,729, a difference of 0.19%).
| Demographics | Rating | Rank | Median Earnings |
| Immigrants | Armenia | 38.3 /100 | #188 | Fair $46,094 |
| Spaniards | 37.2 /100 | #189 | Fair $46,059 |
| French Canadians | 36.1 /100 | #190 | Fair $46,026 |
| Finns | 33.4 /100 | #191 | Fair $45,940 |
| Germans | 33.2 /100 | #192 | Fair $45,935 |
| Guamanians/Chamorros | 33.2 /100 | #193 | Fair $45,933 |
| Immigrants | Costa Rica | 33.0 /100 | #194 | Fair $45,928 |
| Immigrants | St. Vincent and the Grenadines | 32.4 /100 | #195 | Fair $45,908 |
| Yugoslavians | 30.5 /100 | #196 | Fair $45,846 |
| Barbadians | 30.5 /100 | #197 | Fair $45,846 |
| Trinidadians and Tobagonians | 29.7 /100 | #198 | Fair $45,820 |
| Immigrants | Barbados | 29.6 /100 | #199 | Fair $45,816 |
| Immigrants | Azores | 29.5 /100 | #200 | Fair $45,812 |
| Celtics | 27.2 /100 | #201 | Fair $45,732 |
| Immigrants | Trinidad and Tobago | 27.1 /100 | #202 | Fair $45,729 |
| Welsh | 26.6 /100 | #203 | Fair $45,710 |
| Immigrants | Uruguay | 25.9 /100 | #204 | Fair $45,682 |
| Tongans | 25.4 /100 | #205 | Fair $45,665 |
| Immigrants | Ghana | 24.8 /100 | #206 | Fair $45,641 |
| Immigrants | Senegal | 24.0 /100 | #207 | Fair $45,611 |
| Immigrants | Bosnia and Herzegovina | 23.7 /100 | #208 | Fair $45,600 |