Northern European vs Immigrants from Cambodia Median Household Income
COMPARE
Northern European
Immigrants from Cambodia
Median Household Income
Median Household Income Comparison
Northern Europeans
Immigrants from Cambodia
$90,446
MEDIAN HOUSEHOLD INCOME
96.9/ 100
METRIC RATING
112th/ 347
METRIC RANK
$83,304
MEDIAN HOUSEHOLD INCOME
24.0/ 100
METRIC RATING
203rd/ 347
METRIC RANK
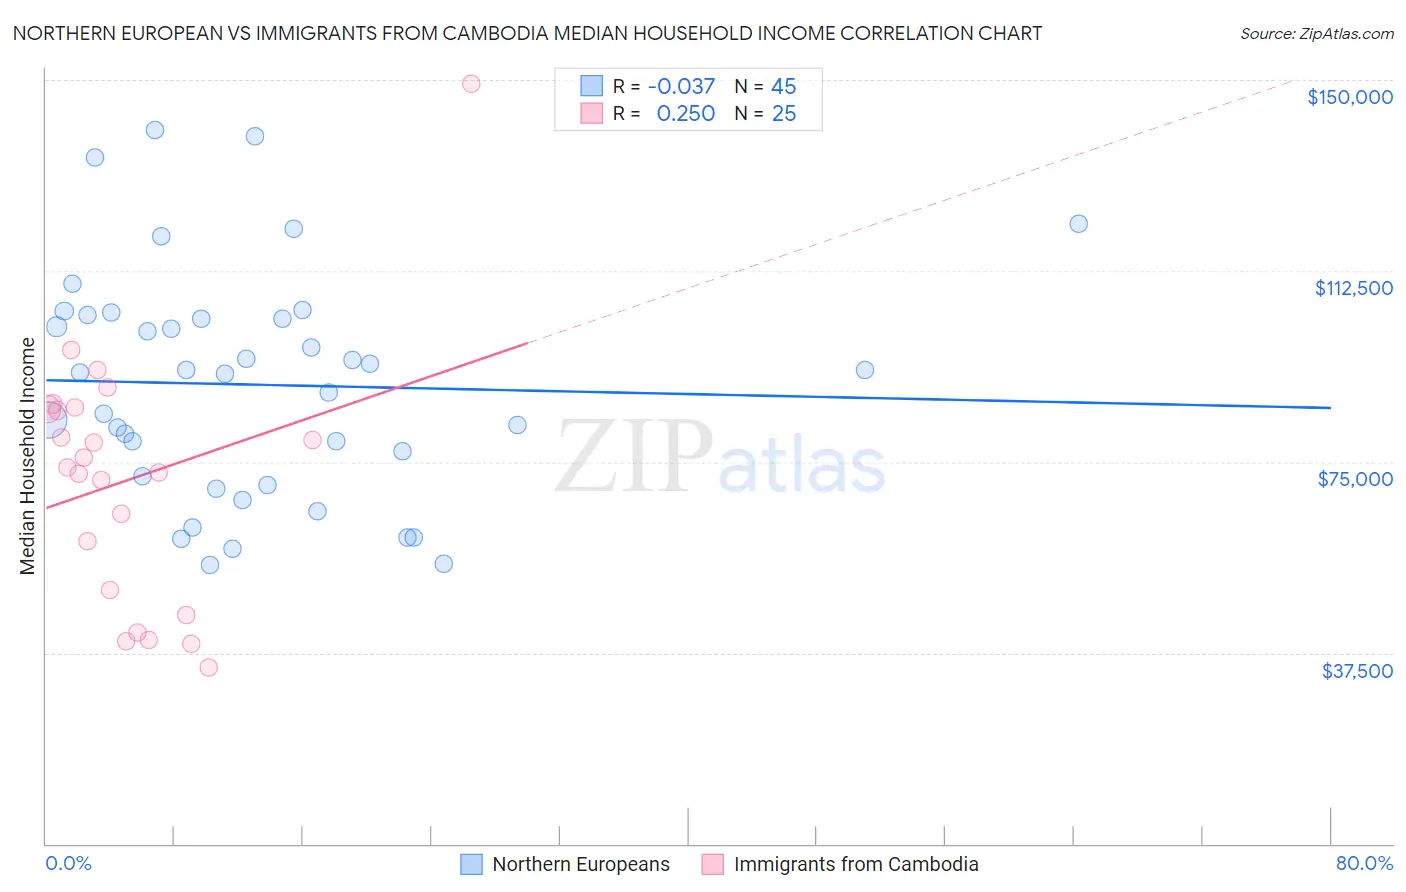
Northern European vs Immigrants from Cambodia Median Household Income Correlation Chart
The statistical analysis conducted on geographies consisting of 405,886,183 people shows no correlation between the proportion of Northern Europeans and median household income in the United States with a correlation coefficient (R) of -0.037 and weighted average of $90,446. Similarly, the statistical analysis conducted on geographies consisting of 205,122,161 people shows a weak positive correlation between the proportion of Immigrants from Cambodia and median household income in the United States with a correlation coefficient (R) of 0.250 and weighted average of $83,304, a difference of 8.6%.
Median Household Income Correlation Summary
| Measurement | Northern European | Immigrants from Cambodia |
| Minimum | $54,809 | $34,518 |
| Maximum | $140,176 | $149,239 |
| Range | $85,367 | $114,721 |
| Mean | $90,148 | $71,594 |
| Median | $92,627 | $73,842 |
| Interquartile 25% (IQ1) | $71,323 | $47,361 |
| Interquartile 75% (IQ3) | $103,516 | $85,484 |
| Interquartile Range (IQR) | $32,192 | $38,123 |
| Standard Deviation (Sample) | $22,235 | $25,130 |
| Standard Deviation (Population) | $21,987 | $24,622 |
Similar Demographics by Median Household Income
Demographics Similar to Northern Europeans by Median Household Income
In terms of median household income, the demographic groups most similar to Northern Europeans are Immigrants from Poland ($90,549, a difference of 0.11%), Palestinian ($90,574, a difference of 0.14%), Chilean ($90,605, a difference of 0.18%), Zimbabwean ($90,618, a difference of 0.19%), and Peruvian ($90,261, a difference of 0.20%).
| Demographics | Rating | Rank | Median Household Income |
| Immigrants | Brazil | 97.7 /100 | #105 | Exceptional $90,907 |
| Macedonians | 97.4 /100 | #106 | Exceptional $90,761 |
| Croatians | 97.3 /100 | #107 | Exceptional $90,685 |
| Zimbabweans | 97.2 /100 | #108 | Exceptional $90,618 |
| Chileans | 97.2 /100 | #109 | Exceptional $90,605 |
| Palestinians | 97.1 /100 | #110 | Exceptional $90,574 |
| Immigrants | Poland | 97.1 /100 | #111 | Exceptional $90,549 |
| Northern Europeans | 96.9 /100 | #112 | Exceptional $90,446 |
| Peruvians | 96.5 /100 | #113 | Exceptional $90,261 |
| Immigrants | Northern Africa | 95.9 /100 | #114 | Exceptional $90,026 |
| Immigrants | Western Asia | 95.9 /100 | #115 | Exceptional $90,005 |
| Native Hawaiians | 95.7 /100 | #116 | Exceptional $89,919 |
| Taiwanese | 95.6 /100 | #117 | Exceptional $89,900 |
| Syrians | 95.4 /100 | #118 | Exceptional $89,830 |
| Albanians | 95.2 /100 | #119 | Exceptional $89,744 |
Demographics Similar to Immigrants from Cambodia by Median Household Income
In terms of median household income, the demographic groups most similar to Immigrants from Cambodia are Immigrants from Africa ($83,289, a difference of 0.020%), Immigrants from Thailand ($83,327, a difference of 0.030%), Tsimshian ($83,346, a difference of 0.050%), Spanish ($83,343, a difference of 0.050%), and German ($83,358, a difference of 0.070%).
| Demographics | Rating | Rank | Median Household Income |
| French | 26.0 /100 | #196 | Fair $83,468 |
| Aleuts | 25.7 /100 | #197 | Fair $83,446 |
| Japanese | 25.1 /100 | #198 | Fair $83,395 |
| Germans | 24.6 /100 | #199 | Fair $83,358 |
| Tsimshian | 24.5 /100 | #200 | Fair $83,346 |
| Spanish | 24.4 /100 | #201 | Fair $83,343 |
| Immigrants | Thailand | 24.3 /100 | #202 | Fair $83,327 |
| Immigrants | Cambodia | 24.0 /100 | #203 | Fair $83,304 |
| Immigrants | Africa | 23.8 /100 | #204 | Fair $83,289 |
| Celtics | 22.7 /100 | #205 | Fair $83,193 |
| Immigrants | Kenya | 21.3 /100 | #206 | Fair $83,068 |
| Dutch | 20.3 /100 | #207 | Fair $82,971 |
| French Canadians | 18.7 /100 | #208 | Poor $82,810 |
| Immigrants | Iraq | 16.7 /100 | #209 | Poor $82,594 |
| Immigrants | Uruguay | 16.4 /100 | #210 | Poor $82,560 |