Bangladeshi vs Sioux Divorced or Separated
COMPARE
Bangladeshi
Sioux
Divorced or Separated
Divorced or Separated Comparison
Bangladeshis
Sioux
12.3%
DIVORCED OR SEPARATED
10.5/ 100
METRIC RATING
222nd/ 347
METRIC RANK
13.2%
DIVORCED OR SEPARATED
0.0/ 100
METRIC RATING
311th/ 347
METRIC RANK
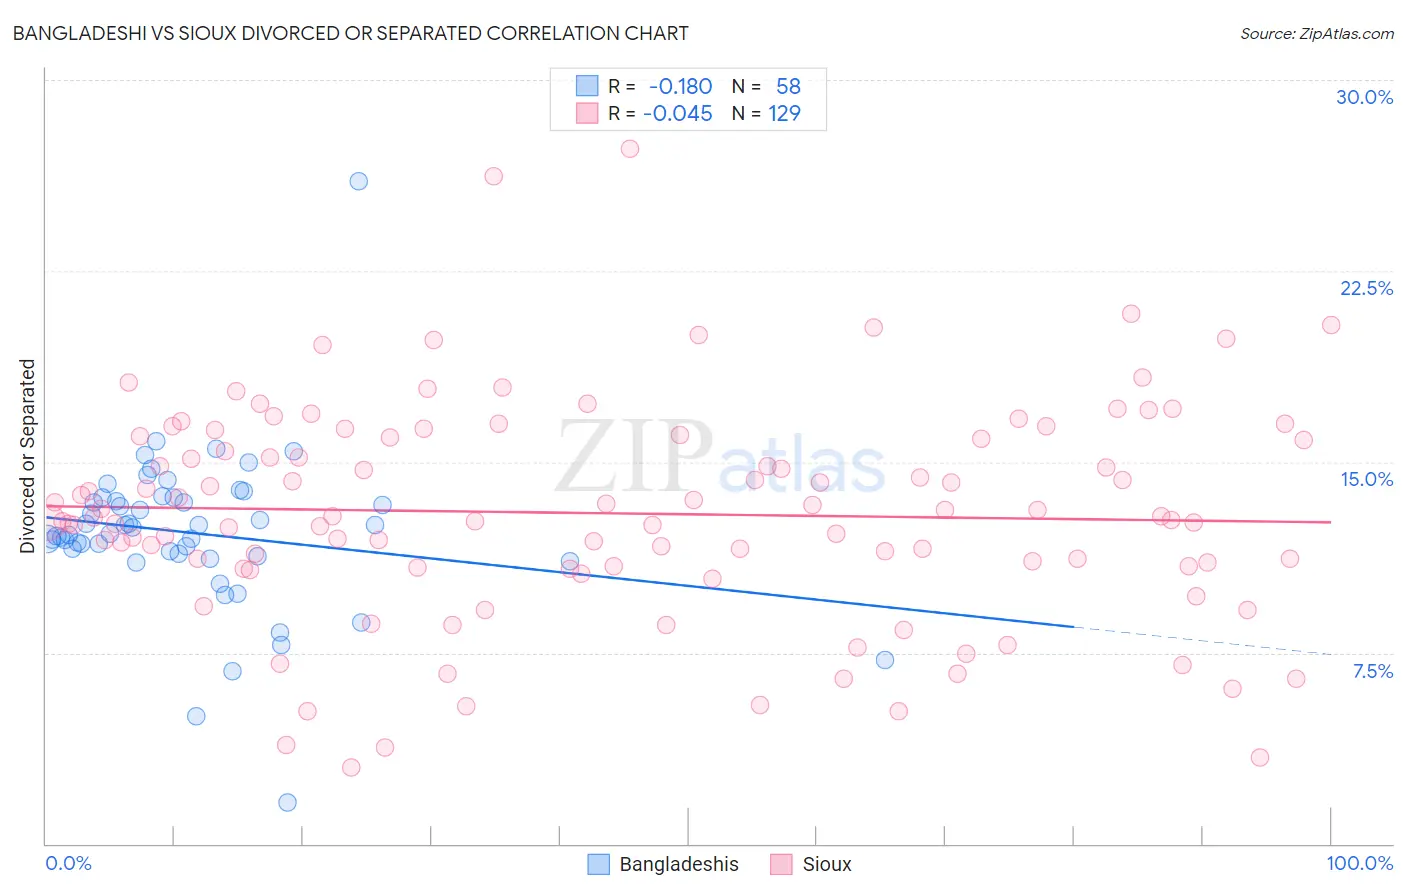
Bangladeshi vs Sioux Divorced or Separated Correlation Chart
The statistical analysis conducted on geographies consisting of 141,409,827 people shows a poor negative correlation between the proportion of Bangladeshis and percentage of population currently divorced or separated in the United States with a correlation coefficient (R) of -0.180 and weighted average of 12.3%. Similarly, the statistical analysis conducted on geographies consisting of 234,160,973 people shows no correlation between the proportion of Sioux and percentage of population currently divorced or separated in the United States with a correlation coefficient (R) of -0.045 and weighted average of 13.2%, a difference of 7.8%.
Divorced or Separated Correlation Summary
| Measurement | Bangladeshi | Sioux |
| Minimum | 1.6% | 3.0% |
| Maximum | 26.0% | 27.3% |
| Range | 24.4% | 24.3% |
| Mean | 12.2% | 13.0% |
| Median | 12.3% | 12.8% |
| Interquartile 25% (IQ1) | 11.4% | 10.9% |
| Interquartile 75% (IQ3) | 13.6% | 16.0% |
| Interquartile Range (IQR) | 2.2% | 5.1% |
| Standard Deviation (Sample) | 3.2% | 4.3% |
| Standard Deviation (Population) | 3.1% | 4.3% |
Similar Demographics by Divorced or Separated
Demographics Similar to Bangladeshis by Divorced or Separated
In terms of divorced or separated, the demographic groups most similar to Bangladeshis are Scandinavian (12.3%, a difference of 0.010%), Guamanian/Chamorro (12.3%, a difference of 0.070%), Immigrants from the Azores (12.3%, a difference of 0.070%), Belgian (12.3%, a difference of 0.080%), and British (12.3%, a difference of 0.10%).
| Demographics | Rating | Rank | Divorced or Separated |
| Europeans | 15.4 /100 | #215 | Poor 12.2% |
| Immigrants | South America | 15.4 /100 | #216 | Poor 12.2% |
| Northern Europeans | 14.7 /100 | #217 | Poor 12.2% |
| Slovenes | 13.2 /100 | #218 | Poor 12.3% |
| Czechoslovakians | 11.7 /100 | #219 | Poor 12.3% |
| British | 11.6 /100 | #220 | Poor 12.3% |
| Guamanians/Chamorros | 11.3 /100 | #221 | Poor 12.3% |
| Bangladeshis | 10.5 /100 | #222 | Poor 12.3% |
| Scandinavians | 10.4 /100 | #223 | Poor 12.3% |
| Immigrants | Azores | 9.7 /100 | #224 | Tragic 12.3% |
| Belgians | 9.7 /100 | #225 | Tragic 12.3% |
| Immigrants | Western Africa | 9.3 /100 | #226 | Tragic 12.3% |
| Hmong | 8.8 /100 | #227 | Tragic 12.3% |
| Immigrants | Cameroon | 8.3 /100 | #228 | Tragic 12.3% |
| Immigrants | Sudan | 8.2 /100 | #229 | Tragic 12.3% |
Demographics Similar to Sioux by Divorced or Separated
In terms of divorced or separated, the demographic groups most similar to Sioux are African (13.2%, a difference of 0.020%), American (13.2%, a difference of 0.040%), Ottawa (13.2%, a difference of 0.050%), French American Indian (13.2%, a difference of 0.14%), and Blackfeet (13.3%, a difference of 0.35%).
| Demographics | Rating | Rank | Divorced or Separated |
| Hopi | 0.0 /100 | #304 | Tragic 13.2% |
| Chippewa | 0.0 /100 | #305 | Tragic 13.2% |
| Tlingit-Haida | 0.0 /100 | #306 | Tragic 13.2% |
| French American Indians | 0.0 /100 | #307 | Tragic 13.2% |
| Ottawa | 0.0 /100 | #308 | Tragic 13.2% |
| Americans | 0.0 /100 | #309 | Tragic 13.2% |
| Africans | 0.0 /100 | #310 | Tragic 13.2% |
| Sioux | 0.0 /100 | #311 | Tragic 13.2% |
| Blackfeet | 0.0 /100 | #312 | Tragic 13.3% |
| Immigrants | Nicaragua | 0.0 /100 | #313 | Tragic 13.3% |
| Yaqui | 0.0 /100 | #314 | Tragic 13.3% |
| Spanish Americans | 0.0 /100 | #315 | Tragic 13.3% |
| Tsimshian | 0.0 /100 | #316 | Tragic 13.3% |
| Haitians | 0.0 /100 | #317 | Tragic 13.3% |
| Cree | 0.0 /100 | #318 | Tragic 13.4% |