Immigrants from Kazakhstan vs Immigrants from Venezuela Per Capita Income
COMPARE
Immigrants from Kazakhstan
Immigrants from Venezuela
Per Capita Income
Per Capita Income Comparison
Immigrants from Kazakhstan
Immigrants from Venezuela
$48,747
PER CAPITA INCOME
99.7/ 100
METRIC RATING
77th/ 347
METRIC RANK
$41,727
PER CAPITA INCOME
10.2/ 100
METRIC RATING
213th/ 347
METRIC RANK
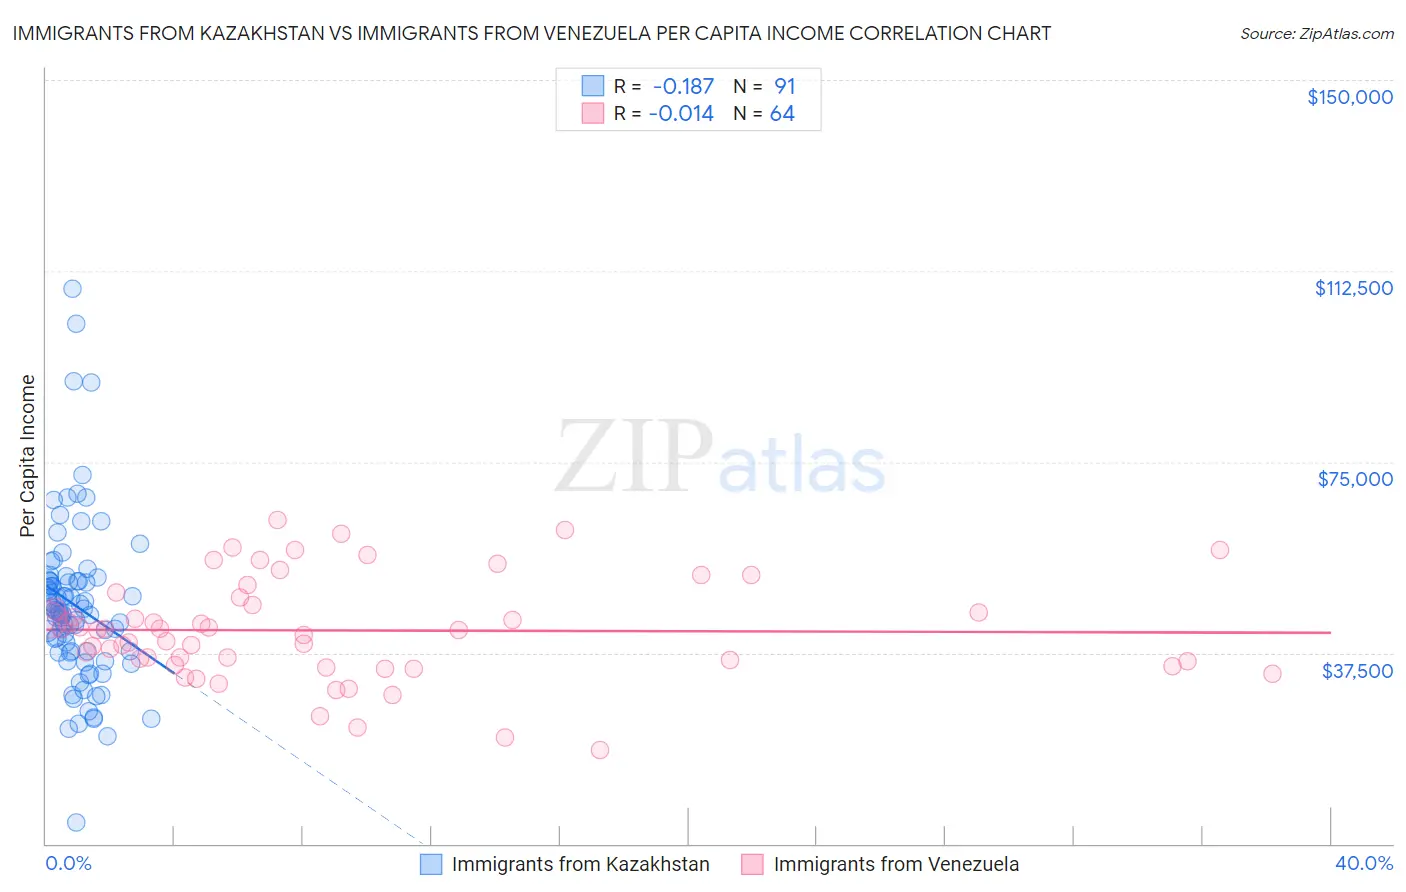
Immigrants from Kazakhstan vs Immigrants from Venezuela Per Capita Income Correlation Chart
The statistical analysis conducted on geographies consisting of 124,442,915 people shows a poor negative correlation between the proportion of Immigrants from Kazakhstan and per capita income in the United States with a correlation coefficient (R) of -0.187 and weighted average of $48,747. Similarly, the statistical analysis conducted on geographies consisting of 287,848,526 people shows no correlation between the proportion of Immigrants from Venezuela and per capita income in the United States with a correlation coefficient (R) of -0.014 and weighted average of $41,727, a difference of 16.8%.
Per Capita Income Correlation Summary
| Measurement | Immigrants from Kazakhstan | Immigrants from Venezuela |
| Minimum | $4,252 | $18,497 |
| Maximum | $109,103 | $63,503 |
| Range | $104,851 | $45,006 |
| Mean | $46,679 | $41,894 |
| Median | $45,620 | $41,937 |
| Interquartile 25% (IQ1) | $37,540 | $35,384 |
| Interquartile 75% (IQ3) | $51,665 | $47,592 |
| Interquartile Range (IQR) | $14,125 | $12,208 |
| Standard Deviation (Sample) | $16,400 | $10,042 |
| Standard Deviation (Population) | $16,310 | $9,963 |
Similar Demographics by Per Capita Income
Demographics Similar to Immigrants from Kazakhstan by Per Capita Income
In terms of per capita income, the demographic groups most similar to Immigrants from Kazakhstan are Immigrants from Italy ($48,654, a difference of 0.19%), Immigrants from England ($48,844, a difference of 0.20%), Immigrants from Bolivia ($48,970, a difference of 0.46%), Romanian ($48,445, a difference of 0.62%), and Egyptian ($48,358, a difference of 0.80%).
| Demographics | Rating | Rank | Per Capita Income |
| Immigrants | Eastern Europe | 99.8 /100 | #70 | Exceptional $49,316 |
| Greeks | 99.8 /100 | #71 | Exceptional $49,309 |
| Immigrants | Hungary | 99.8 /100 | #72 | Exceptional $49,303 |
| Immigrants | North America | 99.8 /100 | #73 | Exceptional $49,302 |
| Mongolians | 99.8 /100 | #74 | Exceptional $49,173 |
| Immigrants | Bolivia | 99.7 /100 | #75 | Exceptional $48,970 |
| Immigrants | England | 99.7 /100 | #76 | Exceptional $48,844 |
| Immigrants | Kazakhstan | 99.7 /100 | #77 | Exceptional $48,747 |
| Immigrants | Italy | 99.6 /100 | #78 | Exceptional $48,654 |
| Romanians | 99.5 /100 | #79 | Exceptional $48,445 |
| Egyptians | 99.5 /100 | #80 | Exceptional $48,358 |
| Armenians | 99.4 /100 | #81 | Exceptional $48,287 |
| Immigrants | Indonesia | 99.4 /100 | #82 | Exceptional $48,195 |
| Immigrants | Brazil | 99.4 /100 | #83 | Exceptional $48,164 |
| Immigrants | Ukraine | 99.3 /100 | #84 | Exceptional $48,134 |
Demographics Similar to Immigrants from Venezuela by Per Capita Income
In terms of per capita income, the demographic groups most similar to Immigrants from Venezuela are Immigrants from Bangladesh ($41,709, a difference of 0.040%), Sudanese ($41,695, a difference of 0.080%), Tongan ($41,693, a difference of 0.080%), Guamanian/Chamorro ($41,678, a difference of 0.12%), and Trinidadian and Tobagonian ($41,655, a difference of 0.17%).
| Demographics | Rating | Rank | Per Capita Income |
| Ghanaians | 15.7 /100 | #206 | Poor $42,164 |
| Venezuelans | 14.4 /100 | #207 | Poor $42,074 |
| Panamanians | 13.9 /100 | #208 | Poor $42,035 |
| Immigrants | Sudan | 13.2 /100 | #209 | Poor $41,986 |
| Ecuadorians | 12.9 /100 | #210 | Poor $41,958 |
| Immigrants | Panama | 11.6 /100 | #211 | Poor $41,853 |
| Immigrants | Senegal | 11.3 /100 | #212 | Poor $41,830 |
| Immigrants | Venezuela | 10.2 /100 | #213 | Poor $41,727 |
| Immigrants | Bangladesh | 10.1 /100 | #214 | Poor $41,709 |
| Sudanese | 9.9 /100 | #215 | Tragic $41,695 |
| Tongans | 9.9 /100 | #216 | Tragic $41,693 |
| Guamanians/Chamorros | 9.7 /100 | #217 | Tragic $41,678 |
| Trinidadians and Tobagonians | 9.5 /100 | #218 | Tragic $41,655 |
| Puget Sound Salish | 8.1 /100 | #219 | Tragic $41,495 |
| Immigrants | Barbados | 7.9 /100 | #220 | Tragic $41,478 |