Immigrants from Nepal vs Immigrants from Venezuela Per Capita Income
COMPARE
Immigrants from Nepal
Immigrants from Venezuela
Per Capita Income
Per Capita Income Comparison
Immigrants from Nepal
Immigrants from Venezuela
$44,187
PER CAPITA INCOME
64.3/ 100
METRIC RATING
158th/ 347
METRIC RANK
$41,727
PER CAPITA INCOME
10.2/ 100
METRIC RATING
213th/ 347
METRIC RANK
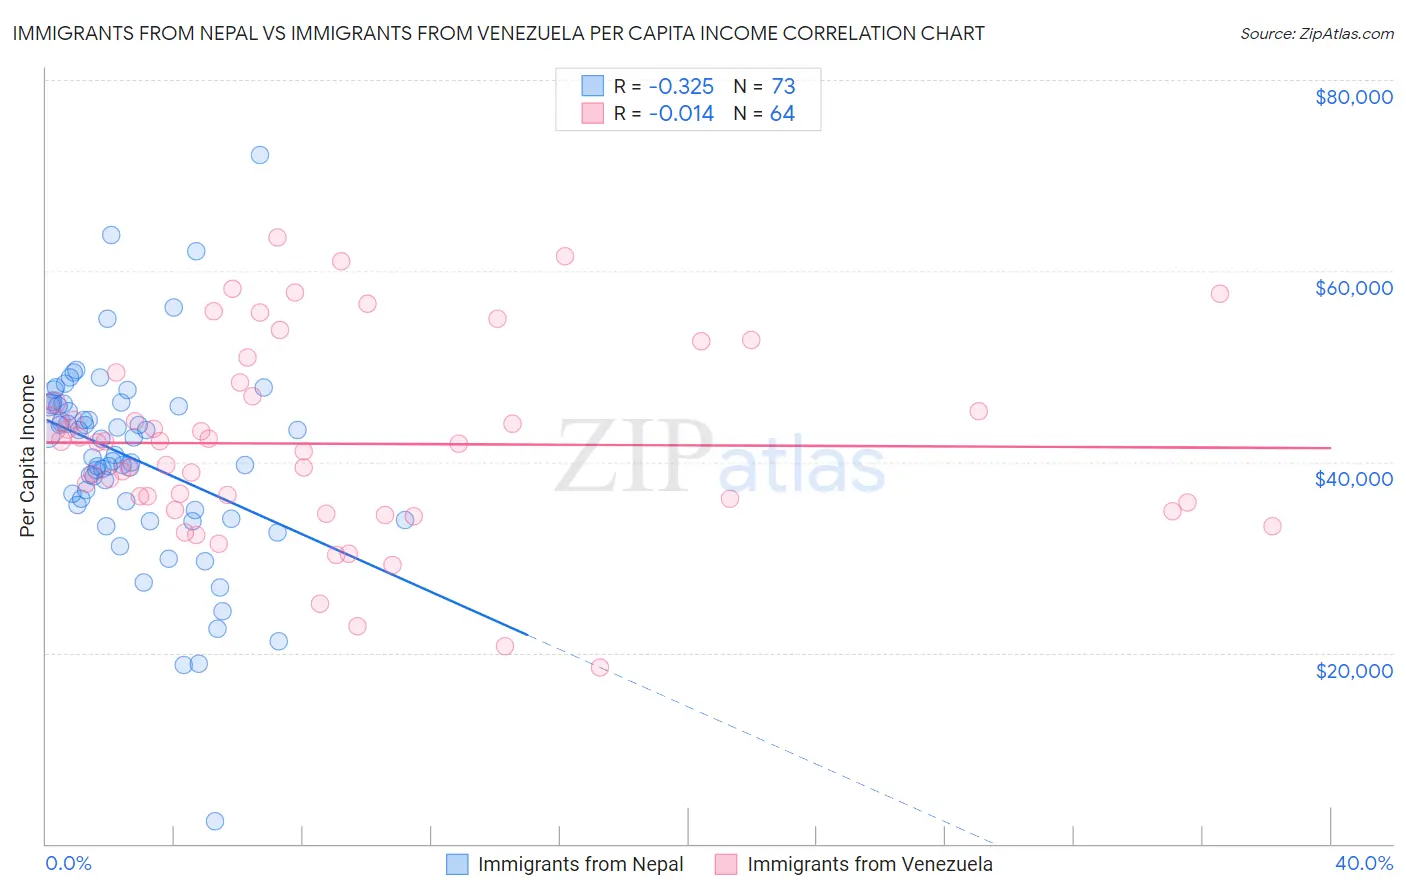
Immigrants from Nepal vs Immigrants from Venezuela Per Capita Income Correlation Chart
The statistical analysis conducted on geographies consisting of 186,792,214 people shows a mild negative correlation between the proportion of Immigrants from Nepal and per capita income in the United States with a correlation coefficient (R) of -0.325 and weighted average of $44,187. Similarly, the statistical analysis conducted on geographies consisting of 287,848,526 people shows no correlation between the proportion of Immigrants from Venezuela and per capita income in the United States with a correlation coefficient (R) of -0.014 and weighted average of $41,727, a difference of 5.9%.
Per Capita Income Correlation Summary
| Measurement | Immigrants from Nepal | Immigrants from Venezuela |
| Minimum | $2,302 | $18,497 |
| Maximum | $72,138 | $63,503 |
| Range | $69,836 | $45,006 |
| Mean | $40,351 | $41,894 |
| Median | $40,773 | $41,937 |
| Interquartile 25% (IQ1) | $35,186 | $35,384 |
| Interquartile 75% (IQ3) | $46,005 | $47,592 |
| Interquartile Range (IQR) | $10,819 | $12,208 |
| Standard Deviation (Sample) | $10,460 | $10,042 |
| Standard Deviation (Population) | $10,388 | $9,963 |
Similar Demographics by Per Capita Income
Demographics Similar to Immigrants from Nepal by Per Capita Income
In terms of per capita income, the demographic groups most similar to Immigrants from Nepal are South American Indian ($44,206, a difference of 0.040%), Slovak ($44,229, a difference of 0.090%), South American ($44,114, a difference of 0.17%), Danish ($44,095, a difference of 0.21%), and Costa Rican ($44,090, a difference of 0.22%).
| Demographics | Rating | Rank | Per Capita Income |
| Norwegians | 71.5 /100 | #151 | Good $44,480 |
| Peruvians | 71.5 /100 | #152 | Good $44,479 |
| Scottish | 70.6 /100 | #153 | Good $44,440 |
| Portuguese | 68.7 /100 | #154 | Good $44,362 |
| Uruguayans | 67.6 /100 | #155 | Good $44,318 |
| Slovaks | 65.4 /100 | #156 | Good $44,229 |
| South American Indians | 64.8 /100 | #157 | Good $44,206 |
| Immigrants | Nepal | 64.3 /100 | #158 | Good $44,187 |
| South Americans | 62.4 /100 | #159 | Good $44,114 |
| Danes | 61.9 /100 | #160 | Good $44,095 |
| Costa Ricans | 61.8 /100 | #161 | Good $44,090 |
| Swiss | 61.4 /100 | #162 | Good $44,076 |
| Immigrants | South America | 61.2 /100 | #163 | Good $44,068 |
| Sri Lankans | 59.8 /100 | #164 | Average $44,014 |
| Immigrants | Philippines | 59.4 /100 | #165 | Average $44,000 |
Demographics Similar to Immigrants from Venezuela by Per Capita Income
In terms of per capita income, the demographic groups most similar to Immigrants from Venezuela are Immigrants from Bangladesh ($41,709, a difference of 0.040%), Sudanese ($41,695, a difference of 0.080%), Tongan ($41,693, a difference of 0.080%), Guamanian/Chamorro ($41,678, a difference of 0.12%), and Trinidadian and Tobagonian ($41,655, a difference of 0.17%).
| Demographics | Rating | Rank | Per Capita Income |
| Ghanaians | 15.7 /100 | #206 | Poor $42,164 |
| Venezuelans | 14.4 /100 | #207 | Poor $42,074 |
| Panamanians | 13.9 /100 | #208 | Poor $42,035 |
| Immigrants | Sudan | 13.2 /100 | #209 | Poor $41,986 |
| Ecuadorians | 12.9 /100 | #210 | Poor $41,958 |
| Immigrants | Panama | 11.6 /100 | #211 | Poor $41,853 |
| Immigrants | Senegal | 11.3 /100 | #212 | Poor $41,830 |
| Immigrants | Venezuela | 10.2 /100 | #213 | Poor $41,727 |
| Immigrants | Bangladesh | 10.1 /100 | #214 | Poor $41,709 |
| Sudanese | 9.9 /100 | #215 | Tragic $41,695 |
| Tongans | 9.9 /100 | #216 | Tragic $41,693 |
| Guamanians/Chamorros | 9.7 /100 | #217 | Tragic $41,678 |
| Trinidadians and Tobagonians | 9.5 /100 | #218 | Tragic $41,655 |
| Puget Sound Salish | 8.1 /100 | #219 | Tragic $41,495 |
| Immigrants | Barbados | 7.9 /100 | #220 | Tragic $41,478 |