Bahamian vs Immigrants from South Central Asia Single Male Poverty
COMPARE
Bahamian
Immigrants from South Central Asia
Single Male Poverty
Single Male Poverty Comparison
Bahamians
Immigrants from South Central Asia
14.6%
SINGLE MALE POVERTY
0.0/ 100
METRIC RATING
291st/ 347
METRIC RANK
10.9%
SINGLE MALE POVERTY
100.0/ 100
METRIC RATING
13th/ 347
METRIC RANK
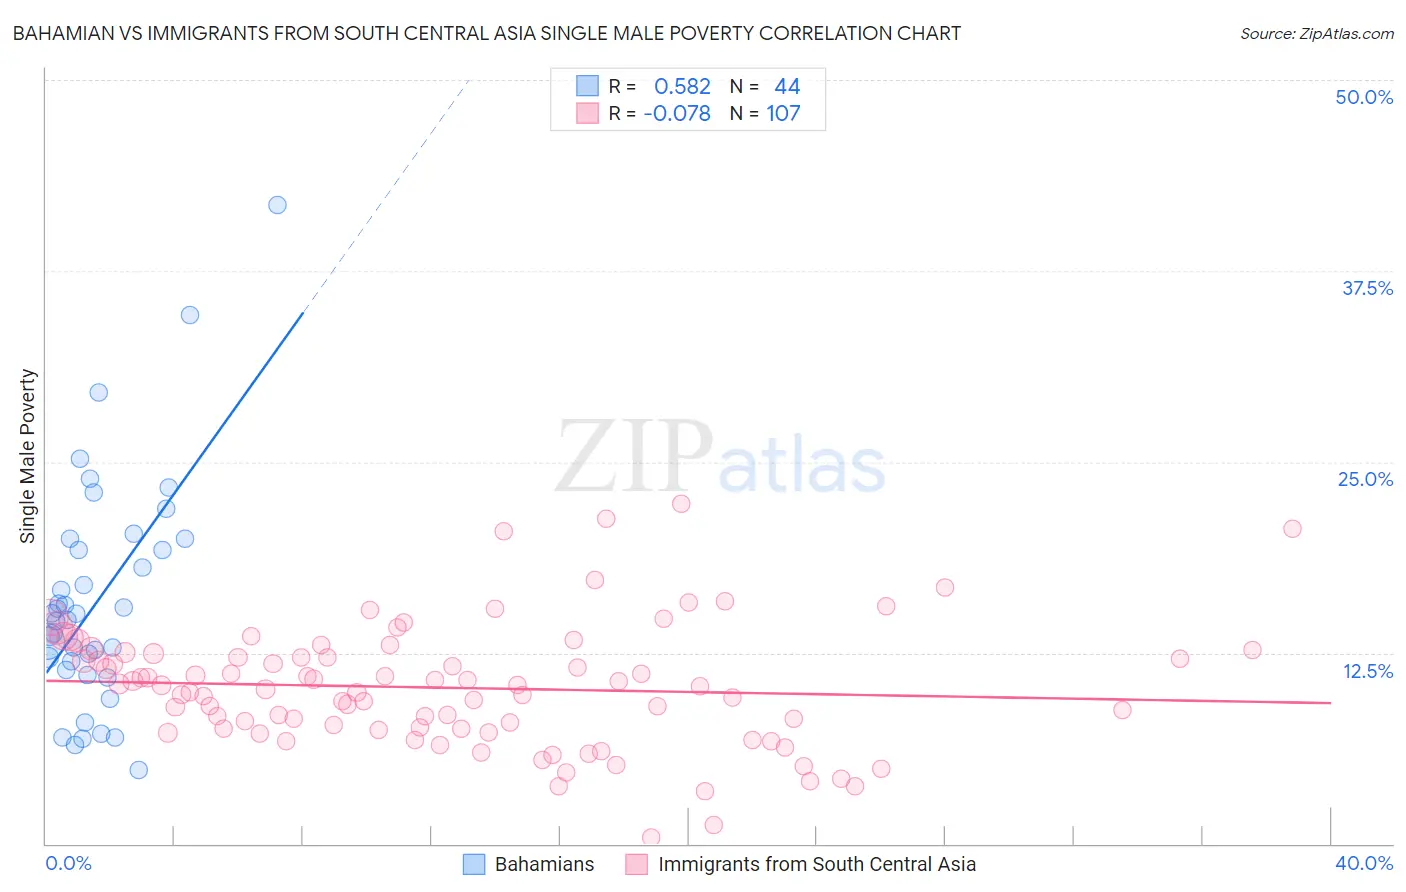
Bahamian vs Immigrants from South Central Asia Single Male Poverty Correlation Chart
The statistical analysis conducted on geographies consisting of 108,151,039 people shows a substantial positive correlation between the proportion of Bahamians and poverty level among single males in the United States with a correlation coefficient (R) of 0.582 and weighted average of 14.6%. Similarly, the statistical analysis conducted on geographies consisting of 409,069,639 people shows a slight negative correlation between the proportion of Immigrants from South Central Asia and poverty level among single males in the United States with a correlation coefficient (R) of -0.078 and weighted average of 10.9%, a difference of 33.3%.
Single Male Poverty Correlation Summary
| Measurement | Bahamian | Immigrants from South Central Asia |
| Minimum | 4.8% | 0.44% |
| Maximum | 41.8% | 22.2% |
| Range | 37.0% | 21.8% |
| Mean | 15.9% | 10.2% |
| Median | 14.8% | 10.3% |
| Interquartile 25% (IQ1) | 11.7% | 7.5% |
| Interquartile 75% (IQ3) | 19.6% | 12.4% |
| Interquartile Range (IQR) | 7.9% | 4.9% |
| Standard Deviation (Sample) | 7.4% | 4.0% |
| Standard Deviation (Population) | 7.4% | 4.0% |
Similar Demographics by Single Male Poverty
Demographics Similar to Bahamians by Single Male Poverty
In terms of single male poverty, the demographic groups most similar to Bahamians are Nonimmigrants (14.6%, a difference of 0.13%), U.S. Virgin Islander (14.5%, a difference of 0.15%), French Canadian (14.6%, a difference of 0.25%), Immigrants from Dominica (14.5%, a difference of 0.38%), and Ottawa (14.6%, a difference of 0.43%).
| Demographics | Rating | Rank | Single Male Poverty |
| Immigrants | Bahamas | 0.0 /100 | #284 | Tragic 14.4% |
| French | 0.0 /100 | #285 | Tragic 14.4% |
| Celtics | 0.0 /100 | #286 | Tragic 14.5% |
| Iroquois | 0.0 /100 | #287 | Tragic 14.5% |
| Whites/Caucasians | 0.0 /100 | #288 | Tragic 14.5% |
| Immigrants | Dominica | 0.0 /100 | #289 | Tragic 14.5% |
| U.S. Virgin Islanders | 0.0 /100 | #290 | Tragic 14.5% |
| Bahamians | 0.0 /100 | #291 | Tragic 14.6% |
| Immigrants | Nonimmigrants | 0.0 /100 | #292 | Tragic 14.6% |
| French Canadians | 0.0 /100 | #293 | Tragic 14.6% |
| Ottawa | 0.0 /100 | #294 | Tragic 14.6% |
| Scotch-Irish | 0.0 /100 | #295 | Tragic 14.7% |
| Africans | 0.0 /100 | #296 | Tragic 14.7% |
| Immigrants | Dominican Republic | 0.0 /100 | #297 | Tragic 14.8% |
| French American Indians | 0.0 /100 | #298 | Tragic 15.0% |
Demographics Similar to Immigrants from South Central Asia by Single Male Poverty
In terms of single male poverty, the demographic groups most similar to Immigrants from South Central Asia are Immigrants from Afghanistan (10.9%, a difference of 0.12%), Immigrants from Philippines (10.9%, a difference of 0.20%), Immigrants from Fiji (10.9%, a difference of 0.22%), Taiwanese (10.9%, a difference of 0.27%), and Chinese (11.0%, a difference of 0.57%).
| Demographics | Rating | Rank | Single Male Poverty |
| Filipinos | 100.0 /100 | #6 | Exceptional 10.6% |
| Afghans | 100.0 /100 | #7 | Exceptional 10.7% |
| Thais | 100.0 /100 | #8 | Exceptional 10.8% |
| Taiwanese | 100.0 /100 | #9 | Exceptional 10.9% |
| Immigrants | Fiji | 100.0 /100 | #10 | Exceptional 10.9% |
| Immigrants | Philippines | 100.0 /100 | #11 | Exceptional 10.9% |
| Immigrants | Afghanistan | 100.0 /100 | #12 | Exceptional 10.9% |
| Immigrants | South Central Asia | 100.0 /100 | #13 | Exceptional 10.9% |
| Chinese | 100.0 /100 | #14 | Exceptional 11.0% |
| Koreans | 100.0 /100 | #15 | Exceptional 11.0% |
| Bhutanese | 100.0 /100 | #16 | Exceptional 11.1% |
| Tsimshian | 100.0 /100 | #17 | Exceptional 11.1% |
| Immigrants | Bolivia | 100.0 /100 | #18 | Exceptional 11.1% |
| Immigrants | Moldova | 100.0 /100 | #19 | Exceptional 11.2% |
| Ethiopians | 100.0 /100 | #20 | Exceptional 11.2% |