Bahamian vs Inupiat Householder Income Under 25 years
COMPARE
Bahamian
Inupiat
Householder Income Under 25 years
Householder Income Under 25 years Comparison
Bahamians
Inupiat
$45,743
HOUSEHOLDER INCOME UNDER 25 YEARS
0.0/ 100
METRIC RATING
327th/ 347
METRIC RANK
$55,935
HOUSEHOLDER INCOME UNDER 25 YEARS
100.0/ 100
METRIC RATING
33rd/ 347
METRIC RANK
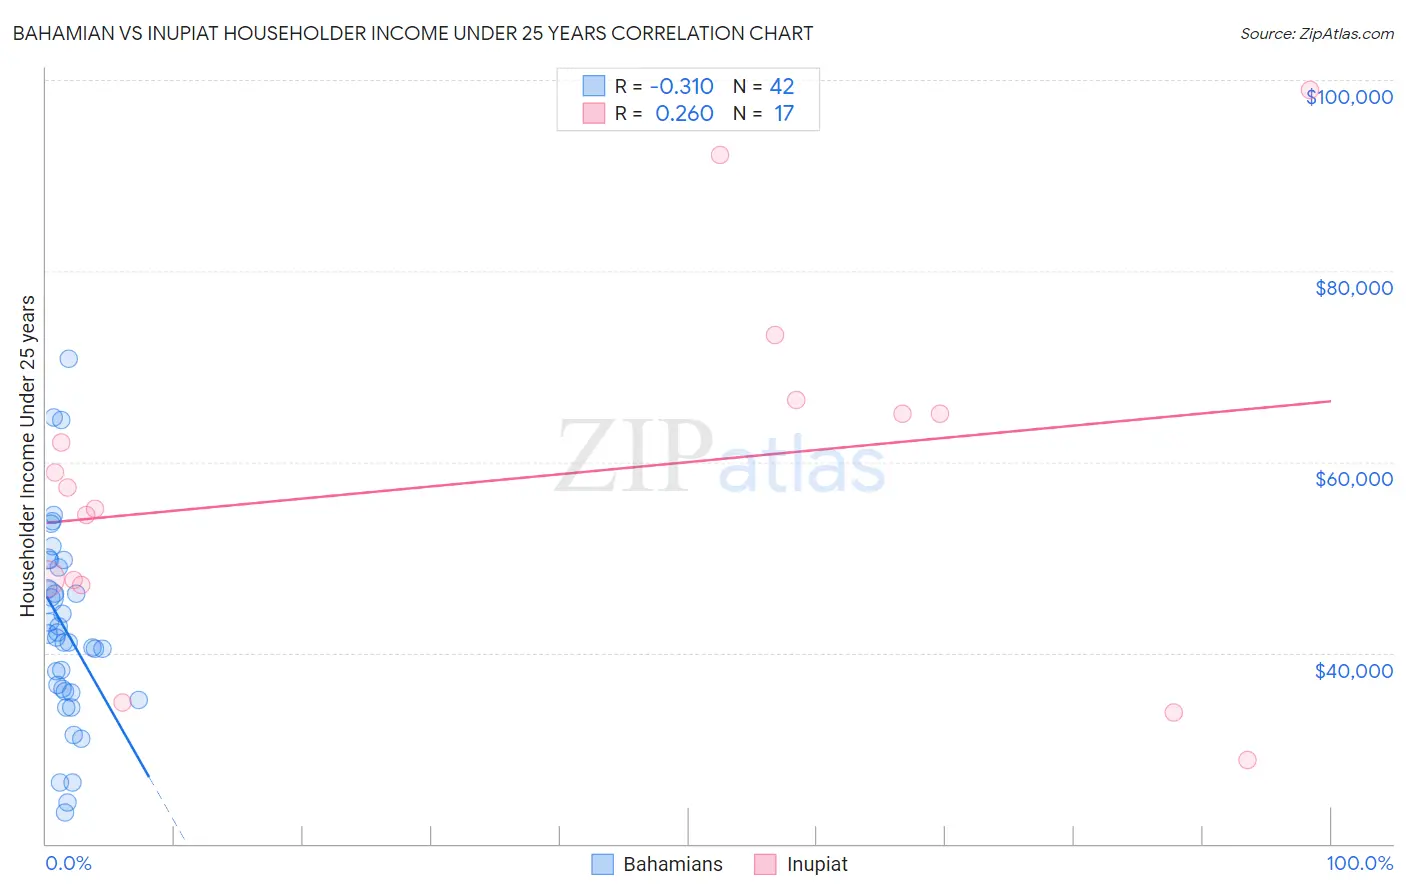
Bahamian vs Inupiat Householder Income Under 25 years Correlation Chart
The statistical analysis conducted on geographies consisting of 104,021,755 people shows a mild negative correlation between the proportion of Bahamians and household income with householder under the age of 25 in the United States with a correlation coefficient (R) of -0.310 and weighted average of $45,743. Similarly, the statistical analysis conducted on geographies consisting of 91,790,948 people shows a weak positive correlation between the proportion of Inupiat and household income with householder under the age of 25 in the United States with a correlation coefficient (R) of 0.260 and weighted average of $55,935, a difference of 22.3%.
Householder Income Under 25 years Correlation Summary
| Measurement | Bahamian | Inupiat |
| Minimum | $23,250 | $28,750 |
| Maximum | $70,795 | $99,000 |
| Range | $47,545 | $70,250 |
| Mean | $42,583 | $58,147 |
| Median | $41,783 | $57,318 |
| Interquartile 25% (IQ1) | $36,008 | $47,352 |
| Interquartile 75% (IQ3) | $48,918 | $65,729 |
| Interquartile Range (IQR) | $12,910 | $18,377 |
| Standard Deviation (Sample) | $10,344 | $18,710 |
| Standard Deviation (Population) | $10,220 | $18,151 |
Similar Demographics by Householder Income Under 25 years
Demographics Similar to Bahamians by Householder Income Under 25 years
In terms of householder income under 25 years, the demographic groups most similar to Bahamians are Osage ($45,764, a difference of 0.050%), Immigrants from Bahamas ($45,793, a difference of 0.11%), German Russian ($45,673, a difference of 0.15%), Dutch West Indian ($45,816, a difference of 0.16%), and Seminole ($45,649, a difference of 0.21%).
| Demographics | Rating | Rank | Householder Income Under 25 years |
| Immigrants | Sudan | 0.0 /100 | #320 | Tragic $46,791 |
| Potawatomi | 0.0 /100 | #321 | Tragic $46,462 |
| Sioux | 0.0 /100 | #322 | Tragic $46,417 |
| Immigrants | Saudi Arabia | 0.0 /100 | #323 | Tragic $46,187 |
| Dutch West Indians | 0.0 /100 | #324 | Tragic $45,816 |
| Immigrants | Bahamas | 0.0 /100 | #325 | Tragic $45,793 |
| Osage | 0.0 /100 | #326 | Tragic $45,764 |
| Bahamians | 0.0 /100 | #327 | Tragic $45,743 |
| German Russians | 0.0 /100 | #328 | Tragic $45,673 |
| Seminole | 0.0 /100 | #329 | Tragic $45,649 |
| Indonesians | 0.0 /100 | #330 | Tragic $45,566 |
| Immigrants | Zaire | 0.0 /100 | #331 | Tragic $45,529 |
| Choctaw | 0.0 /100 | #332 | Tragic $45,450 |
| Creek | 0.0 /100 | #333 | Tragic $45,371 |
| Cajuns | 0.0 /100 | #334 | Tragic $45,338 |
Demographics Similar to Inupiat by Householder Income Under 25 years
In terms of householder income under 25 years, the demographic groups most similar to Inupiat are Immigrants from Japan ($55,932, a difference of 0.010%), Tlingit-Haida ($55,914, a difference of 0.040%), Immigrants from Israel ($55,913, a difference of 0.040%), Immigrants from Russia ($55,891, a difference of 0.080%), and Immigrants from Iran ($55,880, a difference of 0.10%).
| Demographics | Rating | Rank | Householder Income Under 25 years |
| Immigrants | Australia | 100.0 /100 | #26 | Exceptional $56,660 |
| Immigrants | North Macedonia | 100.0 /100 | #27 | Exceptional $56,503 |
| Immigrants | Peru | 100.0 /100 | #28 | Exceptional $56,384 |
| Immigrants | Asia | 100.0 /100 | #29 | Exceptional $56,379 |
| Immigrants | Moldova | 100.0 /100 | #30 | Exceptional $56,168 |
| Vietnamese | 100.0 /100 | #31 | Exceptional $56,127 |
| Peruvians | 100.0 /100 | #32 | Exceptional $56,052 |
| Inupiat | 100.0 /100 | #33 | Exceptional $55,935 |
| Immigrants | Japan | 100.0 /100 | #34 | Exceptional $55,932 |
| Tlingit-Haida | 100.0 /100 | #35 | Exceptional $55,914 |
| Immigrants | Israel | 100.0 /100 | #36 | Exceptional $55,913 |
| Immigrants | Russia | 100.0 /100 | #37 | Exceptional $55,891 |
| Immigrants | Iran | 100.0 /100 | #38 | Exceptional $55,880 |
| Immigrants | Belarus | 100.0 /100 | #39 | Exceptional $55,743 |
| Immigrants | Greece | 100.0 /100 | #40 | Exceptional $55,727 |