Ghanaian vs Immigrants from Ghana Householder Income Under 25 years
COMPARE
Ghanaian
Immigrants from Ghana
Householder Income Under 25 years
Householder Income Under 25 years Comparison
Ghanaians
Immigrants from Ghana
$52,594
HOUSEHOLDER INCOME UNDER 25 YEARS
72.9/ 100
METRIC RATING
157th/ 347
METRIC RANK
$51,333
HOUSEHOLDER INCOME UNDER 25 YEARS
10.9/ 100
METRIC RATING
210th/ 347
METRIC RANK
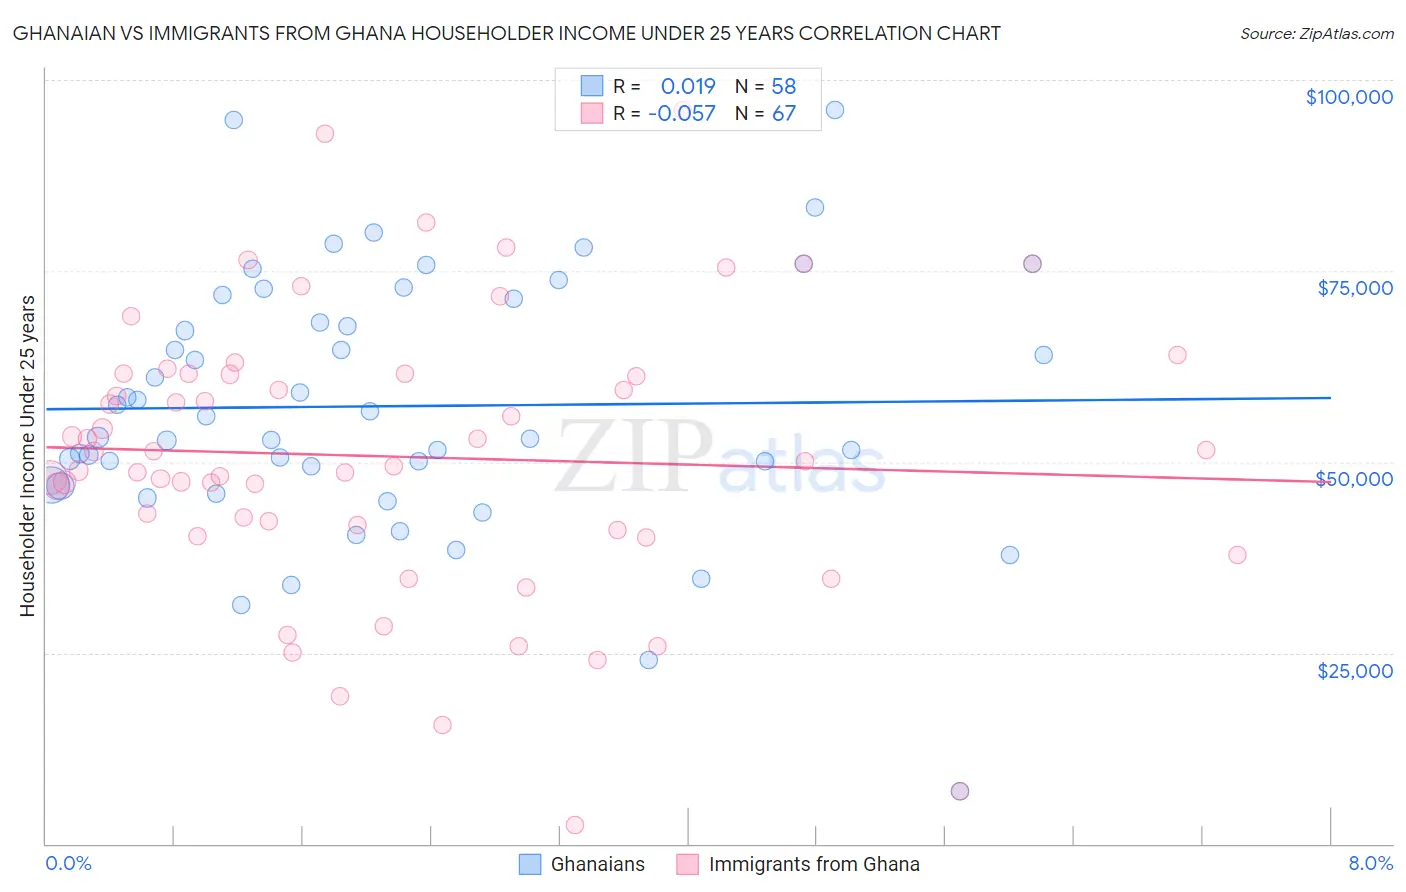
Ghanaian vs Immigrants from Ghana Householder Income Under 25 years Correlation Chart
The statistical analysis conducted on geographies consisting of 172,179,779 people shows no correlation between the proportion of Ghanaians and household income with householder under the age of 25 in the United States with a correlation coefficient (R) of 0.019 and weighted average of $52,594. Similarly, the statistical analysis conducted on geographies consisting of 179,741,503 people shows a slight negative correlation between the proportion of Immigrants from Ghana and household income with householder under the age of 25 in the United States with a correlation coefficient (R) of -0.057 and weighted average of $51,333, a difference of 2.5%.
Householder Income Under 25 years Correlation Summary
| Measurement | Ghanaian | Immigrants from Ghana |
| Minimum | $6,940 | $2,499 |
| Maximum | $96,053 | $96,053 |
| Range | $89,113 | $93,554 |
| Mean | $57,281 | $50,684 |
| Median | $54,641 | $50,114 |
| Interquartile 25% (IQ1) | $46,996 | $41,042 |
| Interquartile 75% (IQ3) | $71,280 | $61,586 |
| Interquartile Range (IQR) | $24,284 | $20,544 |
| Standard Deviation (Sample) | $16,793 | $18,497 |
| Standard Deviation (Population) | $16,648 | $18,359 |
Similar Demographics by Householder Income Under 25 years
Demographics Similar to Ghanaians by Householder Income Under 25 years
In terms of householder income under 25 years, the demographic groups most similar to Ghanaians are Immigrants from Netherlands ($52,592, a difference of 0.0%), Immigrants from Nepal ($52,611, a difference of 0.030%), Immigrants from Denmark ($52,612, a difference of 0.040%), Immigrants from the Azores ($52,621, a difference of 0.050%), and Central American ($52,626, a difference of 0.060%).
| Demographics | Rating | Rank | Householder Income Under 25 years |
| Immigrants | Costa Rica | 75.2 /100 | #150 | Good $52,643 |
| Immigrants | Scotland | 75.0 /100 | #151 | Good $52,638 |
| Trinidadians and Tobagonians | 74.6 /100 | #152 | Good $52,631 |
| Central Americans | 74.4 /100 | #153 | Good $52,626 |
| Immigrants | Azores | 74.2 /100 | #154 | Good $52,621 |
| Immigrants | Denmark | 73.8 /100 | #155 | Good $52,612 |
| Immigrants | Nepal | 73.7 /100 | #156 | Good $52,611 |
| Ghanaians | 72.9 /100 | #157 | Good $52,594 |
| Immigrants | Netherlands | 72.8 /100 | #158 | Good $52,592 |
| Mongolians | 70.2 /100 | #159 | Good $52,540 |
| Immigrants | Turkey | 68.3 /100 | #160 | Good $52,503 |
| Uruguayans | 66.2 /100 | #161 | Good $52,465 |
| Immigrants | Cambodia | 65.4 /100 | #162 | Good $52,450 |
| Immigrants | Chile | 64.8 /100 | #163 | Good $52,440 |
| Immigrants | Trinidad and Tobago | 64.7 /100 | #164 | Good $52,437 |
Demographics Similar to Immigrants from Ghana by Householder Income Under 25 years
In terms of householder income under 25 years, the demographic groups most similar to Immigrants from Ghana are Irish ($51,317, a difference of 0.030%), Syrian ($51,353, a difference of 0.040%), Immigrants from Jordan ($51,370, a difference of 0.070%), Immigrants from Latin America ($51,387, a difference of 0.10%), and South African ($51,383, a difference of 0.10%).
| Demographics | Rating | Rank | Householder Income Under 25 years |
| Immigrants | Cameroon | 13.6 /100 | #203 | Poor $51,433 |
| Czechs | 13.2 /100 | #204 | Poor $51,421 |
| Cape Verdeans | 12.3 /100 | #205 | Poor $51,387 |
| Immigrants | Latin America | 12.3 /100 | #206 | Poor $51,387 |
| South Africans | 12.2 /100 | #207 | Poor $51,383 |
| Immigrants | Jordan | 11.9 /100 | #208 | Poor $51,370 |
| Syrians | 11.4 /100 | #209 | Poor $51,353 |
| Immigrants | Ghana | 10.9 /100 | #210 | Poor $51,333 |
| Irish | 10.6 /100 | #211 | Poor $51,317 |
| Immigrants | Panama | 9.7 /100 | #212 | Tragic $51,278 |
| Dutch | 9.4 /100 | #213 | Tragic $51,265 |
| Zimbabweans | 9.3 /100 | #214 | Tragic $51,259 |
| Icelanders | 9.1 /100 | #215 | Tragic $51,247 |
| French | 8.7 /100 | #216 | Tragic $51,230 |
| Czechoslovakians | 8.6 /100 | #217 | Tragic $51,224 |