Bahamian vs Arapaho Householder Income Under 25 years
COMPARE
Bahamian
Arapaho
Householder Income Under 25 years
Householder Income Under 25 years Comparison
Bahamians
Arapaho
$45,743
HOUSEHOLDER INCOME UNDER 25 YEARS
0.0/ 100
METRIC RATING
327th/ 347
METRIC RANK
$44,003
HOUSEHOLDER INCOME UNDER 25 YEARS
0.0/ 100
METRIC RATING
342nd/ 347
METRIC RANK
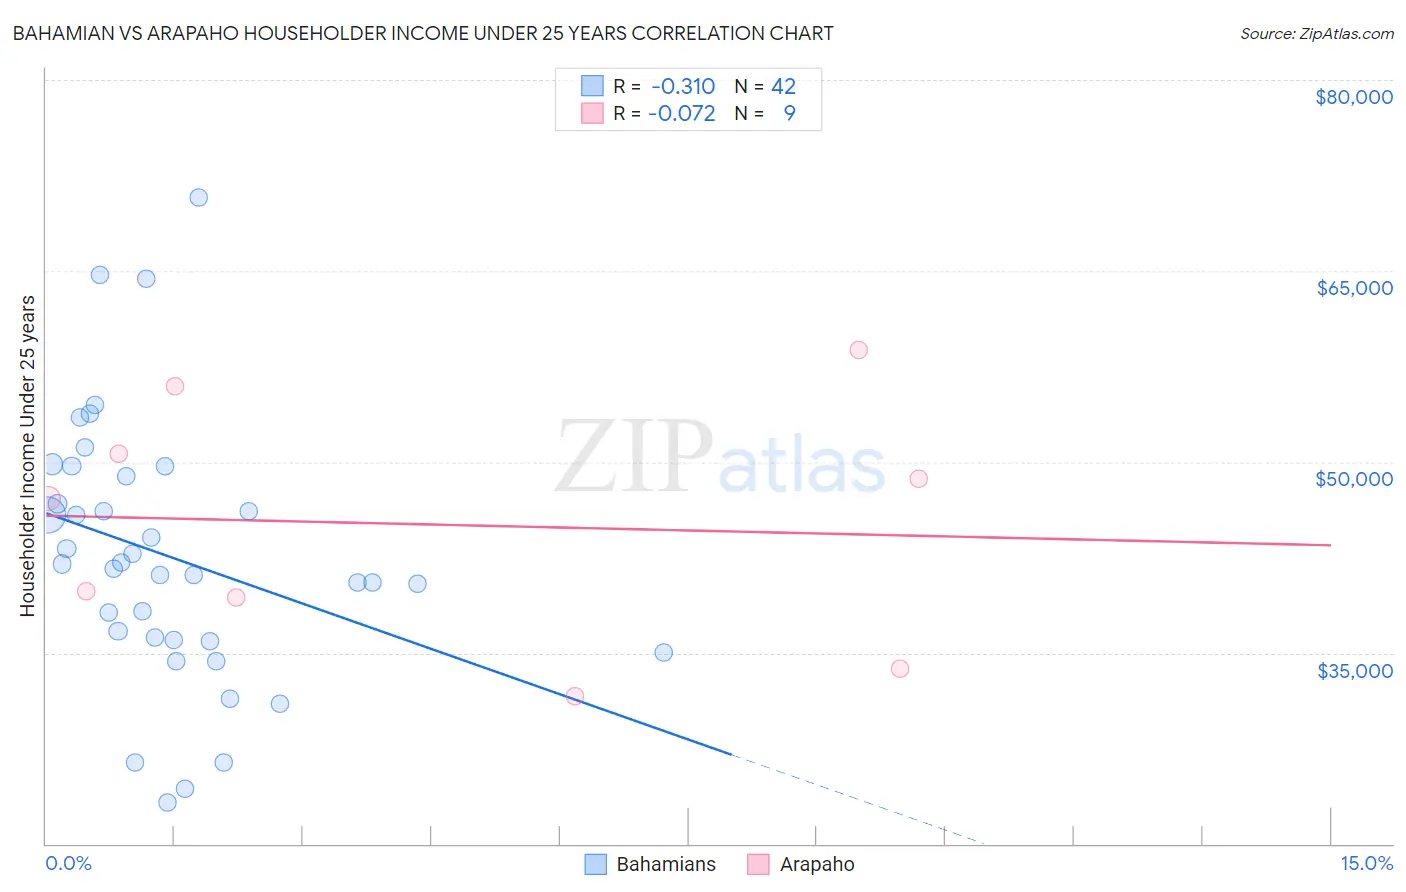
Bahamian vs Arapaho Householder Income Under 25 years Correlation Chart
The statistical analysis conducted on geographies consisting of 104,021,755 people shows a mild negative correlation between the proportion of Bahamians and household income with householder under the age of 25 in the United States with a correlation coefficient (R) of -0.310 and weighted average of $45,743. Similarly, the statistical analysis conducted on geographies consisting of 28,310,734 people shows a slight negative correlation between the proportion of Arapaho and household income with householder under the age of 25 in the United States with a correlation coefficient (R) of -0.072 and weighted average of $44,003, a difference of 4.0%.
Householder Income Under 25 years Correlation Summary
| Measurement | Bahamian | Arapaho |
| Minimum | $23,250 | $31,607 |
| Maximum | $70,795 | $58,750 |
| Range | $47,545 | $27,143 |
| Mean | $42,583 | $45,071 |
| Median | $41,783 | $47,132 |
| Interquartile 25% (IQ1) | $36,008 | $36,562 |
| Interquartile 75% (IQ3) | $48,918 | $53,264 |
| Interquartile Range (IQR) | $12,910 | $16,702 |
| Standard Deviation (Sample) | $10,344 | $9,498 |
| Standard Deviation (Population) | $10,220 | $8,955 |
Demographics Similar to Bahamians and Arapaho by Householder Income Under 25 years
In terms of householder income under 25 years, the demographic groups most similar to Bahamians are Osage ($45,764, a difference of 0.050%), Immigrants from Bahamas ($45,793, a difference of 0.11%), German Russian ($45,673, a difference of 0.15%), Dutch West Indian ($45,816, a difference of 0.16%), and Seminole ($45,649, a difference of 0.21%). Similarly, the demographic groups most similar to Arapaho are Houma ($44,356, a difference of 0.80%), Black/African American ($44,381, a difference of 0.86%), Immigrants from Yemen ($43,591, a difference of 0.95%), Kiowa ($44,733, a difference of 1.7%), and Immigrants from Congo ($43,266, a difference of 1.7%).
| Demographics | Rating | Rank | Householder Income Under 25 years |
| Dutch West Indians | 0.0 /100 | #324 | Tragic $45,816 |
| Immigrants | Bahamas | 0.0 /100 | #325 | Tragic $45,793 |
| Osage | 0.0 /100 | #326 | Tragic $45,764 |
| Bahamians | 0.0 /100 | #327 | Tragic $45,743 |
| German Russians | 0.0 /100 | #328 | Tragic $45,673 |
| Seminole | 0.0 /100 | #329 | Tragic $45,649 |
| Indonesians | 0.0 /100 | #330 | Tragic $45,566 |
| Immigrants | Zaire | 0.0 /100 | #331 | Tragic $45,529 |
| Choctaw | 0.0 /100 | #332 | Tragic $45,450 |
| Creek | 0.0 /100 | #333 | Tragic $45,371 |
| Cajuns | 0.0 /100 | #334 | Tragic $45,338 |
| Cheyenne | 0.0 /100 | #335 | Tragic $45,275 |
| Tohono O'odham | 0.0 /100 | #336 | Tragic $45,248 |
| Pueblo | 0.0 /100 | #337 | Tragic $45,018 |
| Chickasaw | 0.0 /100 | #338 | Tragic $44,763 |
| Kiowa | 0.0 /100 | #339 | Tragic $44,733 |
| Blacks/African Americans | 0.0 /100 | #340 | Tragic $44,381 |
| Houma | 0.0 /100 | #341 | Tragic $44,356 |
| Arapaho | 0.0 /100 | #342 | Tragic $44,003 |
| Immigrants | Yemen | 0.0 /100 | #343 | Tragic $43,591 |
| Immigrants | Congo | 0.0 /100 | #344 | Tragic $43,266 |