Bahamian vs Immigrants from Hong Kong Householder Income Under 25 years
COMPARE
Bahamian
Immigrants from Hong Kong
Householder Income Under 25 years
Householder Income Under 25 years Comparison
Bahamians
Immigrants from Hong Kong
$45,743
HOUSEHOLDER INCOME UNDER 25 YEARS
0.0/ 100
METRIC RATING
327th/ 347
METRIC RANK
$62,083
HOUSEHOLDER INCOME UNDER 25 YEARS
100.0/ 100
METRIC RATING
2nd/ 347
METRIC RANK
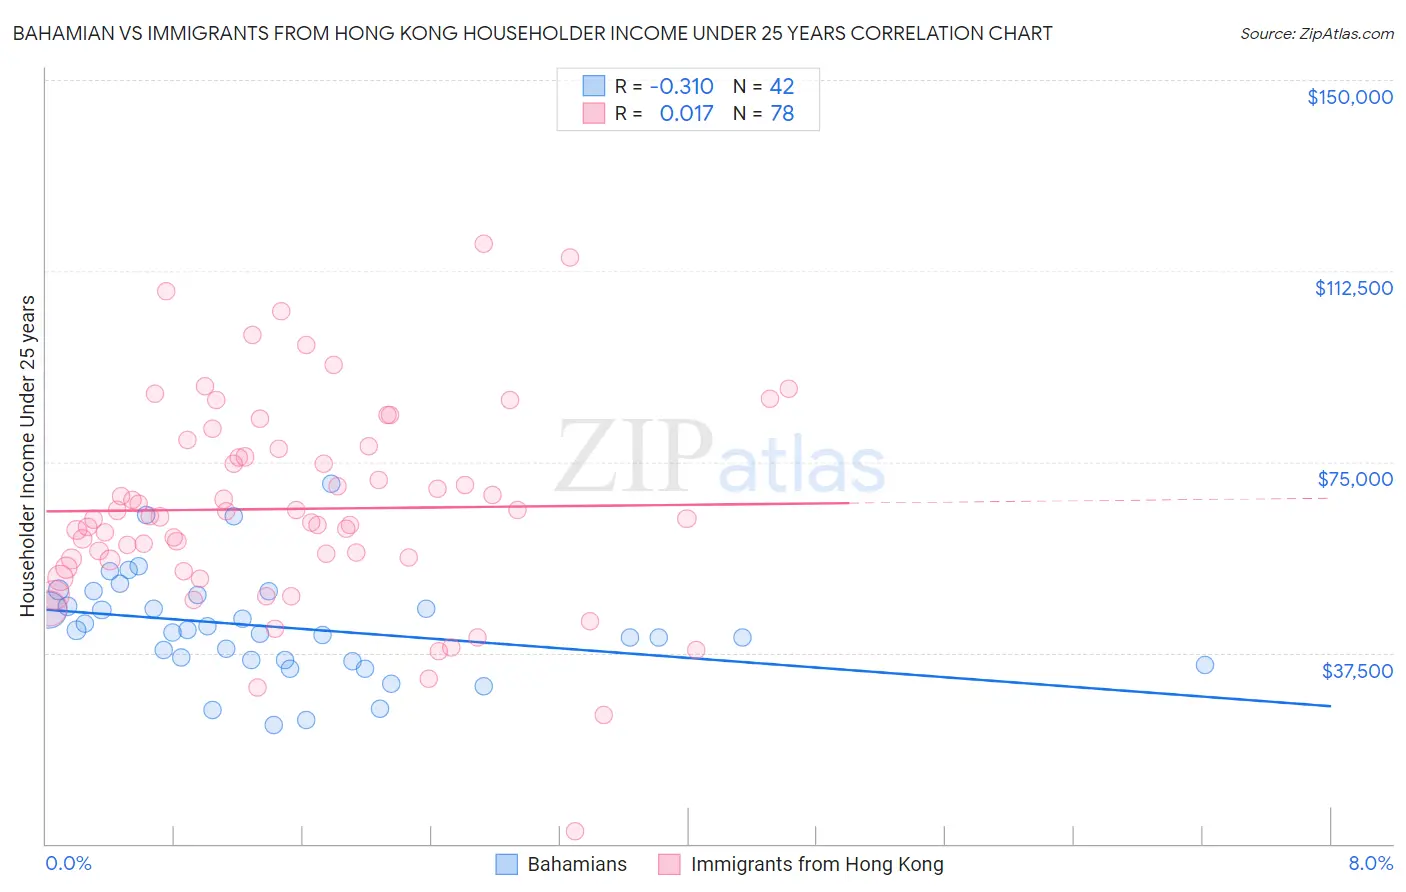
Bahamian vs Immigrants from Hong Kong Householder Income Under 25 years Correlation Chart
The statistical analysis conducted on geographies consisting of 104,021,755 people shows a mild negative correlation between the proportion of Bahamians and household income with householder under the age of 25 in the United States with a correlation coefficient (R) of -0.310 and weighted average of $45,743. Similarly, the statistical analysis conducted on geographies consisting of 218,049,197 people shows no correlation between the proportion of Immigrants from Hong Kong and household income with householder under the age of 25 in the United States with a correlation coefficient (R) of 0.017 and weighted average of $62,083, a difference of 35.7%.
Householder Income Under 25 years Correlation Summary
| Measurement | Bahamian | Immigrants from Hong Kong |
| Minimum | $23,250 | $2,499 |
| Maximum | $70,795 | $117,772 |
| Range | $47,545 | $115,273 |
| Mean | $42,583 | $65,784 |
| Median | $41,783 | $64,057 |
| Interquartile 25% (IQ1) | $36,008 | $55,752 |
| Interquartile 75% (IQ3) | $48,918 | $77,500 |
| Interquartile Range (IQR) | $12,910 | $21,748 |
| Standard Deviation (Sample) | $10,344 | $20,300 |
| Standard Deviation (Population) | $10,220 | $20,169 |
Similar Demographics by Householder Income Under 25 years
Demographics Similar to Bahamians by Householder Income Under 25 years
In terms of householder income under 25 years, the demographic groups most similar to Bahamians are Osage ($45,764, a difference of 0.050%), Immigrants from Bahamas ($45,793, a difference of 0.11%), German Russian ($45,673, a difference of 0.15%), Dutch West Indian ($45,816, a difference of 0.16%), and Seminole ($45,649, a difference of 0.21%).
| Demographics | Rating | Rank | Householder Income Under 25 years |
| Immigrants | Sudan | 0.0 /100 | #320 | Tragic $46,791 |
| Potawatomi | 0.0 /100 | #321 | Tragic $46,462 |
| Sioux | 0.0 /100 | #322 | Tragic $46,417 |
| Immigrants | Saudi Arabia | 0.0 /100 | #323 | Tragic $46,187 |
| Dutch West Indians | 0.0 /100 | #324 | Tragic $45,816 |
| Immigrants | Bahamas | 0.0 /100 | #325 | Tragic $45,793 |
| Osage | 0.0 /100 | #326 | Tragic $45,764 |
| Bahamians | 0.0 /100 | #327 | Tragic $45,743 |
| German Russians | 0.0 /100 | #328 | Tragic $45,673 |
| Seminole | 0.0 /100 | #329 | Tragic $45,649 |
| Indonesians | 0.0 /100 | #330 | Tragic $45,566 |
| Immigrants | Zaire | 0.0 /100 | #331 | Tragic $45,529 |
| Choctaw | 0.0 /100 | #332 | Tragic $45,450 |
| Creek | 0.0 /100 | #333 | Tragic $45,371 |
| Cajuns | 0.0 /100 | #334 | Tragic $45,338 |
Demographics Similar to Immigrants from Hong Kong by Householder Income Under 25 years
In terms of householder income under 25 years, the demographic groups most similar to Immigrants from Hong Kong are Immigrants from India ($59,914, a difference of 3.6%), Immigrants from Taiwan ($59,424, a difference of 4.5%), Immigrants from Bolivia ($59,389, a difference of 4.5%), Thai ($59,187, a difference of 4.9%), and Assyrian/Chaldean/Syriac ($65,329, a difference of 5.2%).
| Demographics | Rating | Rank | Householder Income Under 25 years |
| Assyrians/Chaldeans/Syriacs | 100.0 /100 | #1 | Exceptional $65,329 |
| Immigrants | Hong Kong | 100.0 /100 | #2 | Exceptional $62,083 |
| Immigrants | India | 100.0 /100 | #3 | Exceptional $59,914 |
| Immigrants | Taiwan | 100.0 /100 | #4 | Exceptional $59,424 |
| Immigrants | Bolivia | 100.0 /100 | #5 | Exceptional $59,389 |
| Thais | 100.0 /100 | #6 | Exceptional $59,187 |
| Bolivians | 100.0 /100 | #7 | Exceptional $58,506 |
| Indians (Asian) | 100.0 /100 | #8 | Exceptional $58,239 |
| Chinese | 100.0 /100 | #9 | Exceptional $58,162 |
| Afghans | 100.0 /100 | #10 | Exceptional $58,019 |
| Immigrants | China | 100.0 /100 | #11 | Exceptional $57,931 |
| Immigrants | Philippines | 100.0 /100 | #12 | Exceptional $57,930 |
| Immigrants | South Central Asia | 100.0 /100 | #13 | Exceptional $57,818 |
| Filipinos | 100.0 /100 | #14 | Exceptional $57,740 |
| Koreans | 100.0 /100 | #15 | Exceptional $57,730 |