Zimbabwean vs Immigrants from Ghana Householder Income Under 25 years
COMPARE
Zimbabwean
Immigrants from Ghana
Householder Income Under 25 years
Householder Income Under 25 years Comparison
Zimbabweans
Immigrants from Ghana
$51,259
HOUSEHOLDER INCOME UNDER 25 YEARS
9.3/ 100
METRIC RATING
214th/ 347
METRIC RANK
$51,333
HOUSEHOLDER INCOME UNDER 25 YEARS
10.9/ 100
METRIC RATING
210th/ 347
METRIC RANK
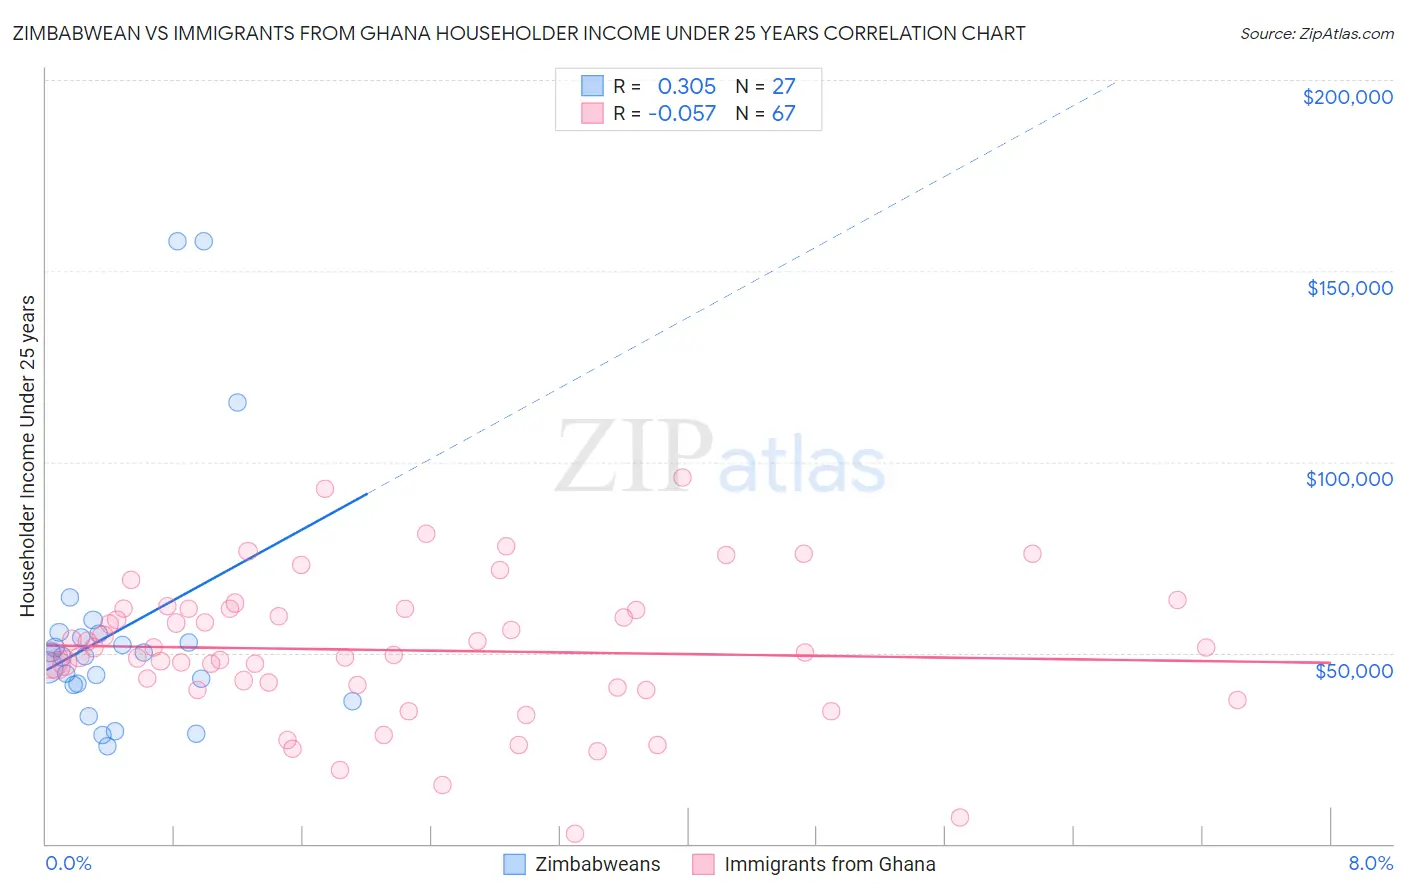
Zimbabwean vs Immigrants from Ghana Householder Income Under 25 years Correlation Chart
The statistical analysis conducted on geographies consisting of 66,344,715 people shows a mild positive correlation between the proportion of Zimbabweans and household income with householder under the age of 25 in the United States with a correlation coefficient (R) of 0.305 and weighted average of $51,259. Similarly, the statistical analysis conducted on geographies consisting of 179,741,503 people shows a slight negative correlation between the proportion of Immigrants from Ghana and household income with householder under the age of 25 in the United States with a correlation coefficient (R) of -0.057 and weighted average of $51,333, a difference of 0.14%.
Householder Income Under 25 years Correlation Summary
| Measurement | Zimbabwean | Immigrants from Ghana |
| Minimum | $25,388 | $2,499 |
| Maximum | $157,810 | $96,053 |
| Range | $132,422 | $93,554 |
| Mean | $56,178 | $50,684 |
| Median | $48,971 | $50,114 |
| Interquartile 25% (IQ1) | $41,511 | $41,042 |
| Interquartile 75% (IQ3) | $55,000 | $61,586 |
| Interquartile Range (IQR) | $13,489 | $20,544 |
| Standard Deviation (Sample) | $33,671 | $18,497 |
| Standard Deviation (Population) | $33,042 | $18,359 |
Demographics Similar to Zimbabweans and Immigrants from Ghana by Householder Income Under 25 years
In terms of householder income under 25 years, the demographic groups most similar to Zimbabweans are Dutch ($51,265, a difference of 0.010%), Icelander ($51,247, a difference of 0.020%), Immigrants from Panama ($51,278, a difference of 0.040%), French ($51,230, a difference of 0.060%), and Czechoslovakian ($51,224, a difference of 0.070%). Similarly, the demographic groups most similar to Immigrants from Ghana are Irish ($51,317, a difference of 0.030%), Syrian ($51,353, a difference of 0.040%), Immigrants from Jordan ($51,370, a difference of 0.070%), Immigrants from Latin America ($51,387, a difference of 0.10%), and South African ($51,383, a difference of 0.10%).
| Demographics | Rating | Rank | Householder Income Under 25 years |
| Immigrants | Guatemala | 14.0 /100 | #202 | Poor $51,447 |
| Immigrants | Cameroon | 13.6 /100 | #203 | Poor $51,433 |
| Czechs | 13.2 /100 | #204 | Poor $51,421 |
| Cape Verdeans | 12.3 /100 | #205 | Poor $51,387 |
| Immigrants | Latin America | 12.3 /100 | #206 | Poor $51,387 |
| South Africans | 12.2 /100 | #207 | Poor $51,383 |
| Immigrants | Jordan | 11.9 /100 | #208 | Poor $51,370 |
| Syrians | 11.4 /100 | #209 | Poor $51,353 |
| Immigrants | Ghana | 10.9 /100 | #210 | Poor $51,333 |
| Irish | 10.6 /100 | #211 | Poor $51,317 |
| Immigrants | Panama | 9.7 /100 | #212 | Tragic $51,278 |
| Dutch | 9.4 /100 | #213 | Tragic $51,265 |
| Zimbabweans | 9.3 /100 | #214 | Tragic $51,259 |
| Icelanders | 9.1 /100 | #215 | Tragic $51,247 |
| French | 8.7 /100 | #216 | Tragic $51,230 |
| Czechoslovakians | 8.6 /100 | #217 | Tragic $51,224 |
| Immigrants | Belize | 8.6 /100 | #218 | Tragic $51,223 |
| Arabs | 8.5 /100 | #219 | Tragic $51,219 |
| Immigrants | Germany | 8.0 /100 | #220 | Tragic $51,190 |
| Immigrants | Eastern Africa | 7.4 /100 | #221 | Tragic $51,158 |
| Spaniards | 6.8 /100 | #222 | Tragic $51,117 |