South African vs Immigrants from Dominica Median Male Earnings
COMPARE
South African
Immigrants from Dominica
Median Male Earnings
Median Male Earnings Comparison
South Africans
Immigrants from Dominica
$61,460
MEDIAN MALE EARNINGS
99.9/ 100
METRIC RATING
53rd/ 347
METRIC RANK
$47,651
MEDIAN MALE EARNINGS
0.1/ 100
METRIC RATING
292nd/ 347
METRIC RANK
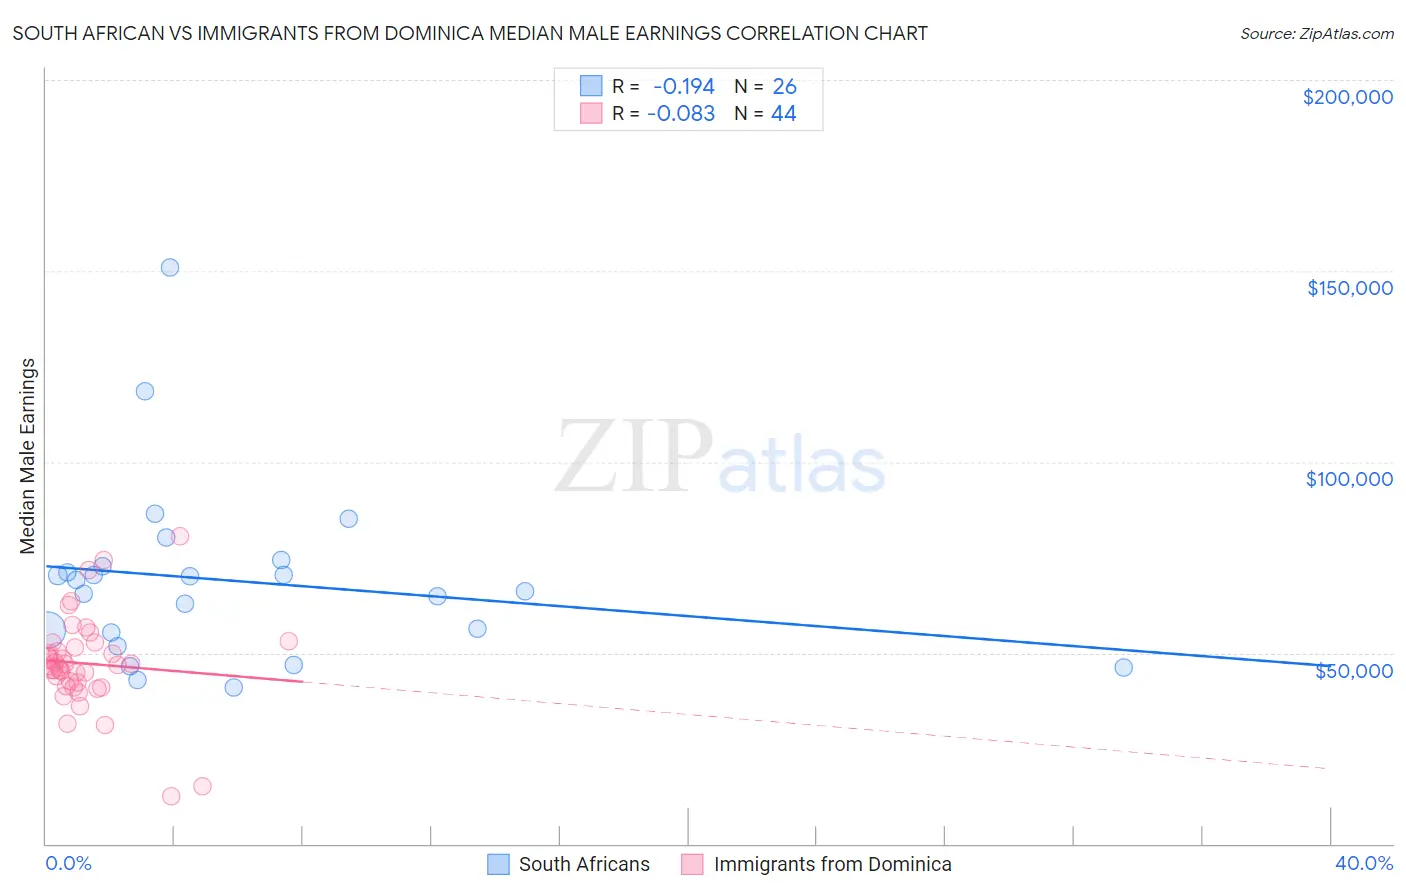
South African vs Immigrants from Dominica Median Male Earnings Correlation Chart
The statistical analysis conducted on geographies consisting of 182,591,048 people shows a poor negative correlation between the proportion of South Africans and median male earnings in the United States with a correlation coefficient (R) of -0.194 and weighted average of $61,460. Similarly, the statistical analysis conducted on geographies consisting of 83,786,748 people shows a slight negative correlation between the proportion of Immigrants from Dominica and median male earnings in the United States with a correlation coefficient (R) of -0.083 and weighted average of $47,651, a difference of 29.0%.
Median Male Earnings Correlation Summary
| Measurement | South African | Immigrants from Dominica |
| Minimum | $40,972 | $12,476 |
| Maximum | $150,965 | $80,370 |
| Range | $109,993 | $67,894 |
| Mean | $68,892 | $47,178 |
| Median | $67,477 | $46,677 |
| Interquartile 25% (IQ1) | $55,347 | $41,694 |
| Interquartile 75% (IQ3) | $72,701 | $51,930 |
| Interquartile Range (IQR) | $17,354 | $10,236 |
| Standard Deviation (Sample) | $23,483 | $12,354 |
| Standard Deviation (Population) | $23,027 | $12,213 |
Similar Demographics by Median Male Earnings
Demographics Similar to South Africans by Median Male Earnings
In terms of median male earnings, the demographic groups most similar to South Africans are Immigrants from Latvia ($61,422, a difference of 0.060%), Immigrants from Norway ($61,628, a difference of 0.27%), Greek ($61,242, a difference of 0.36%), Lithuanian ($61,228, a difference of 0.38%), and Immigrants from Scotland ($61,220, a difference of 0.39%).
| Demographics | Rating | Rank | Median Male Earnings |
| Immigrants | Czechoslovakia | 99.9 /100 | #46 | Exceptional $62,217 |
| Immigrants | Austria | 99.9 /100 | #47 | Exceptional $62,164 |
| Immigrants | Malaysia | 99.9 /100 | #48 | Exceptional $62,121 |
| Immigrants | Europe | 99.9 /100 | #49 | Exceptional $62,057 |
| Bhutanese | 99.9 /100 | #50 | Exceptional $61,759 |
| Estonians | 99.9 /100 | #51 | Exceptional $61,710 |
| Immigrants | Norway | 99.9 /100 | #52 | Exceptional $61,628 |
| South Africans | 99.9 /100 | #53 | Exceptional $61,460 |
| Immigrants | Latvia | 99.9 /100 | #54 | Exceptional $61,422 |
| Greeks | 99.9 /100 | #55 | Exceptional $61,242 |
| Lithuanians | 99.9 /100 | #56 | Exceptional $61,228 |
| Immigrants | Scotland | 99.9 /100 | #57 | Exceptional $61,220 |
| New Zealanders | 99.9 /100 | #58 | Exceptional $61,199 |
| Immigrants | Netherlands | 99.8 /100 | #59 | Exceptional $61,096 |
| Egyptians | 99.8 /100 | #60 | Exceptional $61,095 |
Demographics Similar to Immigrants from Dominica by Median Male Earnings
In terms of median male earnings, the demographic groups most similar to Immigrants from Dominica are Choctaw ($47,729, a difference of 0.16%), Indonesian ($47,503, a difference of 0.31%), Immigrants from Belize ($47,809, a difference of 0.33%), Immigrants from Nicaragua ($47,482, a difference of 0.36%), and Chickasaw ($47,832, a difference of 0.38%).
| Demographics | Rating | Rank | Median Male Earnings |
| Paiute | 0.2 /100 | #285 | Tragic $47,991 |
| Mexican American Indians | 0.2 /100 | #286 | Tragic $47,990 |
| Immigrants | El Salvador | 0.2 /100 | #287 | Tragic $47,973 |
| Shoshone | 0.2 /100 | #288 | Tragic $47,930 |
| Chickasaw | 0.1 /100 | #289 | Tragic $47,832 |
| Immigrants | Belize | 0.1 /100 | #290 | Tragic $47,809 |
| Choctaw | 0.1 /100 | #291 | Tragic $47,729 |
| Immigrants | Dominica | 0.1 /100 | #292 | Tragic $47,651 |
| Indonesians | 0.1 /100 | #293 | Tragic $47,503 |
| Immigrants | Nicaragua | 0.1 /100 | #294 | Tragic $47,482 |
| Central American Indians | 0.1 /100 | #295 | Tragic $47,433 |
| Inupiat | 0.1 /100 | #296 | Tragic $47,281 |
| Dominicans | 0.1 /100 | #297 | Tragic $47,204 |
| Immigrants | Micronesia | 0.1 /100 | #298 | Tragic $47,177 |
| Immigrants | Zaire | 0.1 /100 | #299 | Tragic $47,070 |