Malaysian vs Austrian Median Household Income
COMPARE
Malaysian
Austrian
Median Household Income
Median Household Income Comparison
Malaysians
Austrians
$81,064
MEDIAN HOUSEHOLD INCOME
7.0/ 100
METRIC RATING
224th/ 347
METRIC RANK
$91,339
MEDIAN HOUSEHOLD INCOME
98.2/ 100
METRIC RATING
102nd/ 347
METRIC RANK
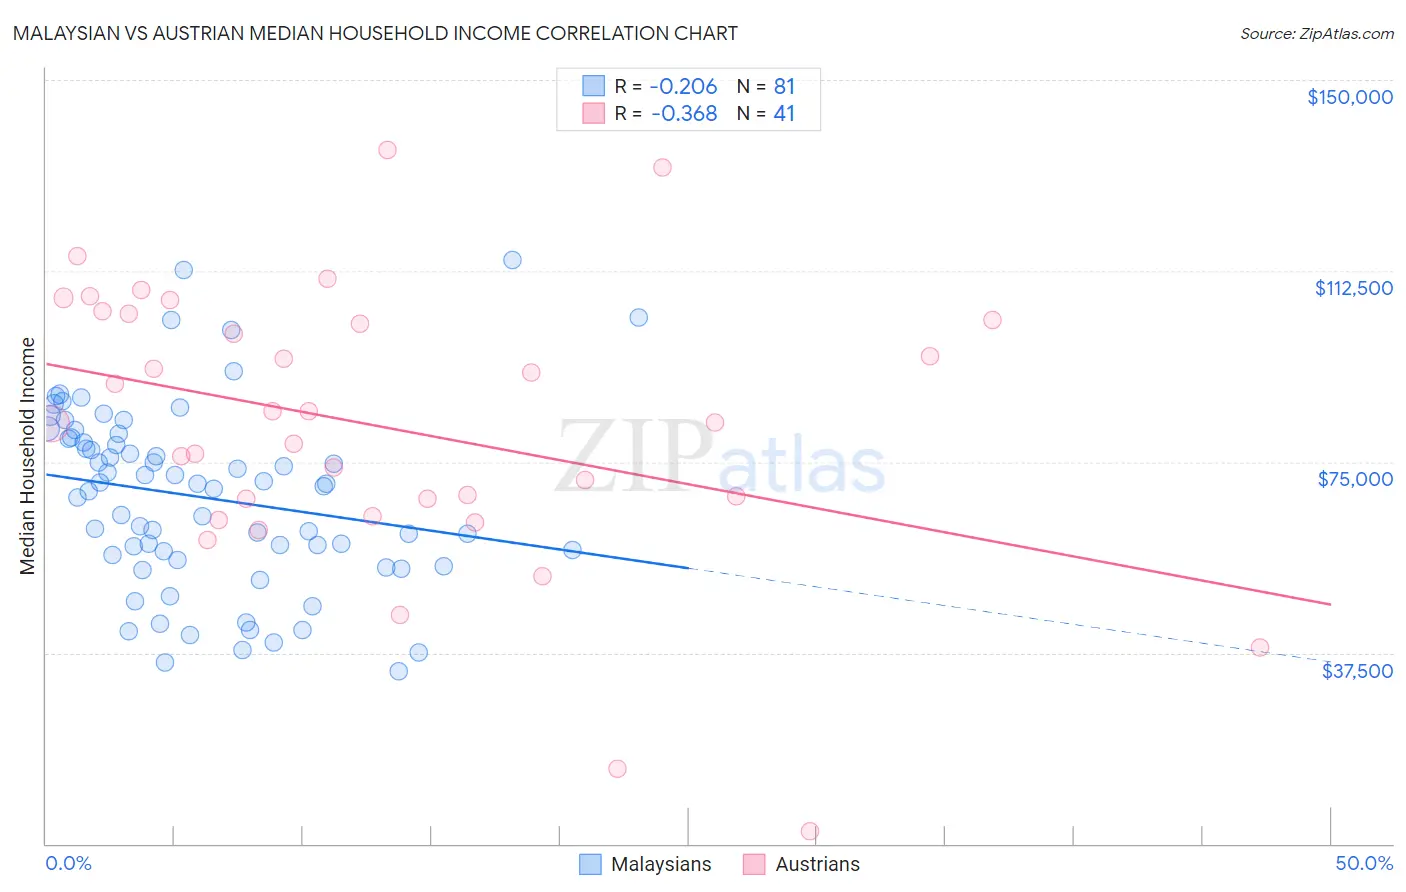
Malaysian vs Austrian Median Household Income Correlation Chart
The statistical analysis conducted on geographies consisting of 225,962,750 people shows a weak negative correlation between the proportion of Malaysians and median household income in the United States with a correlation coefficient (R) of -0.206 and weighted average of $81,064. Similarly, the statistical analysis conducted on geographies consisting of 451,682,607 people shows a mild negative correlation between the proportion of Austrians and median household income in the United States with a correlation coefficient (R) of -0.368 and weighted average of $91,339, a difference of 12.7%.
Median Household Income Correlation Summary
| Measurement | Malaysian | Austrian |
| Minimum | $33,804 | $2,499 |
| Maximum | $114,680 | $136,149 |
| Range | $80,876 | $133,650 |
| Mean | $68,008 | $81,843 |
| Median | $70,094 | $82,650 |
| Interquartile 25% (IQ1) | $56,150 | $65,934 |
| Interquartile 75% (IQ3) | $79,730 | $103,488 |
| Interquartile Range (IQR) | $23,581 | $37,555 |
| Standard Deviation (Sample) | $17,902 | $27,786 |
| Standard Deviation (Population) | $17,791 | $27,445 |
Similar Demographics by Median Household Income
Demographics Similar to Malaysians by Median Household Income
In terms of median household income, the demographic groups most similar to Malaysians are Scotch-Irish ($80,972, a difference of 0.11%), Immigrants from El Salvador ($81,213, a difference of 0.18%), Immigrants from Nigeria ($81,236, a difference of 0.21%), Immigrants from Panama ($80,873, a difference of 0.24%), and Guyanese ($80,734, a difference of 0.41%).
| Demographics | Rating | Rank | Median Household Income |
| Ecuadorians | 12.5 /100 | #217 | Poor $82,070 |
| Whites/Caucasians | 12.2 /100 | #218 | Poor $82,029 |
| Nigerians | 10.3 /100 | #219 | Poor $81,725 |
| Immigrants | Venezuela | 9.0 /100 | #220 | Tragic $81,506 |
| Immigrants | Ghana | 9.0 /100 | #221 | Tragic $81,489 |
| Immigrants | Nigeria | 7.7 /100 | #222 | Tragic $81,236 |
| Immigrants | El Salvador | 7.6 /100 | #223 | Tragic $81,213 |
| Malaysians | 7.0 /100 | #224 | Tragic $81,064 |
| Scotch-Irish | 6.6 /100 | #225 | Tragic $80,972 |
| Immigrants | Panama | 6.2 /100 | #226 | Tragic $80,873 |
| Guyanese | 5.7 /100 | #227 | Tragic $80,734 |
| Immigrants | Bangladesh | 5.7 /100 | #228 | Tragic $80,722 |
| Delaware | 5.0 /100 | #229 | Tragic $80,527 |
| Bermudans | 4.7 /100 | #230 | Tragic $80,406 |
| Trinidadians and Tobagonians | 4.7 /100 | #231 | Tragic $80,402 |
Demographics Similar to Austrians by Median Household Income
In terms of median household income, the demographic groups most similar to Austrians are Immigrants from Moldova ($91,446, a difference of 0.12%), Ukrainian ($91,456, a difference of 0.13%), Immigrants from South Eastern Asia ($91,541, a difference of 0.22%), Immigrants from Ukraine ($91,124, a difference of 0.24%), and Immigrants from Southern Europe ($91,605, a difference of 0.29%).
| Demographics | Rating | Rank | Median Household Income |
| Armenians | 98.7 /100 | #95 | Exceptional $91,807 |
| Jordanians | 98.7 /100 | #96 | Exceptional $91,794 |
| Immigrants | Serbia | 98.6 /100 | #97 | Exceptional $91,730 |
| Immigrants | Southern Europe | 98.5 /100 | #98 | Exceptional $91,605 |
| Immigrants | South Eastern Asia | 98.4 /100 | #99 | Exceptional $91,541 |
| Ukrainians | 98.3 /100 | #100 | Exceptional $91,456 |
| Immigrants | Moldova | 98.3 /100 | #101 | Exceptional $91,446 |
| Austrians | 98.2 /100 | #102 | Exceptional $91,339 |
| Immigrants | Ukraine | 98.0 /100 | #103 | Exceptional $91,124 |
| Immigrants | Kazakhstan | 97.8 /100 | #104 | Exceptional $91,015 |
| Immigrants | Brazil | 97.7 /100 | #105 | Exceptional $90,907 |
| Macedonians | 97.4 /100 | #106 | Exceptional $90,761 |
| Croatians | 97.3 /100 | #107 | Exceptional $90,685 |
| Zimbabweans | 97.2 /100 | #108 | Exceptional $90,618 |
| Chileans | 97.2 /100 | #109 | Exceptional $90,605 |