Cuban vs Austrian Median Household Income
COMPARE
Cuban
Austrian
Median Household Income
Median Household Income Comparison
Cubans
Austrians
$73,392
MEDIAN HOUSEHOLD INCOME
0.1/ 100
METRIC RATING
295th/ 347
METRIC RANK
$91,339
MEDIAN HOUSEHOLD INCOME
98.2/ 100
METRIC RATING
102nd/ 347
METRIC RANK
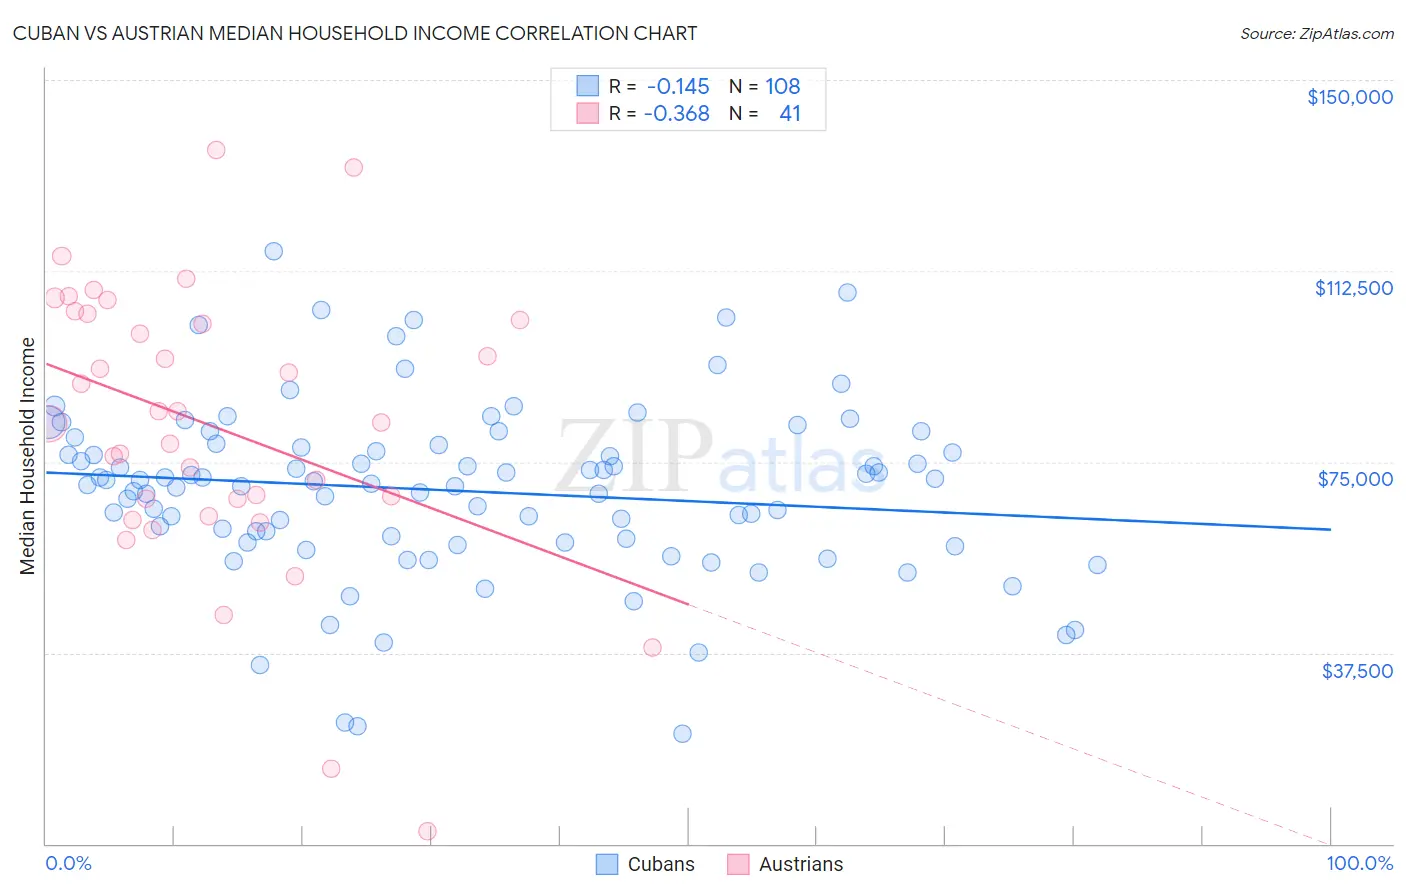
Cuban vs Austrian Median Household Income Correlation Chart
The statistical analysis conducted on geographies consisting of 448,852,866 people shows a poor negative correlation between the proportion of Cubans and median household income in the United States with a correlation coefficient (R) of -0.145 and weighted average of $73,392. Similarly, the statistical analysis conducted on geographies consisting of 451,682,607 people shows a mild negative correlation between the proportion of Austrians and median household income in the United States with a correlation coefficient (R) of -0.368 and weighted average of $91,339, a difference of 24.4%.
Median Household Income Correlation Summary
| Measurement | Cuban | Austrian |
| Minimum | $21,567 | $2,499 |
| Maximum | $116,431 | $136,149 |
| Range | $94,864 | $133,650 |
| Mean | $69,339 | $81,843 |
| Median | $70,955 | $82,650 |
| Interquartile 25% (IQ1) | $59,587 | $65,934 |
| Interquartile 75% (IQ3) | $78,118 | $103,488 |
| Interquartile Range (IQR) | $18,531 | $37,555 |
| Standard Deviation (Sample) | $17,087 | $27,786 |
| Standard Deviation (Population) | $17,007 | $27,445 |
Similar Demographics by Median Household Income
Demographics Similar to Cubans by Median Household Income
In terms of median household income, the demographic groups most similar to Cubans are Haitian ($73,306, a difference of 0.12%), Blackfeet ($73,509, a difference of 0.16%), Immigrants from Cabo Verde ($73,515, a difference of 0.17%), Immigrants from Mexico ($73,160, a difference of 0.32%), and Comanche ($73,747, a difference of 0.48%).
| Demographics | Rating | Rank | Median Household Income |
| Immigrants | Central America | 0.1 /100 | #288 | Tragic $74,217 |
| Fijians | 0.1 /100 | #289 | Tragic $74,205 |
| Bangladeshis | 0.1 /100 | #290 | Tragic $74,112 |
| Hispanics or Latinos | 0.1 /100 | #291 | Tragic $73,823 |
| Comanche | 0.1 /100 | #292 | Tragic $73,747 |
| Immigrants | Cabo Verde | 0.1 /100 | #293 | Tragic $73,515 |
| Blackfeet | 0.1 /100 | #294 | Tragic $73,509 |
| Cubans | 0.1 /100 | #295 | Tragic $73,392 |
| Haitians | 0.1 /100 | #296 | Tragic $73,306 |
| Immigrants | Mexico | 0.0 /100 | #297 | Tragic $73,160 |
| Paiute | 0.0 /100 | #298 | Tragic $72,959 |
| Indonesians | 0.0 /100 | #299 | Tragic $72,856 |
| Immigrants | Dominica | 0.0 /100 | #300 | Tragic $72,760 |
| Cherokee | 0.0 /100 | #301 | Tragic $72,682 |
| Shoshone | 0.0 /100 | #302 | Tragic $72,660 |
Demographics Similar to Austrians by Median Household Income
In terms of median household income, the demographic groups most similar to Austrians are Immigrants from Moldova ($91,446, a difference of 0.12%), Ukrainian ($91,456, a difference of 0.13%), Immigrants from South Eastern Asia ($91,541, a difference of 0.22%), Immigrants from Ukraine ($91,124, a difference of 0.24%), and Immigrants from Southern Europe ($91,605, a difference of 0.29%).
| Demographics | Rating | Rank | Median Household Income |
| Armenians | 98.7 /100 | #95 | Exceptional $91,807 |
| Jordanians | 98.7 /100 | #96 | Exceptional $91,794 |
| Immigrants | Serbia | 98.6 /100 | #97 | Exceptional $91,730 |
| Immigrants | Southern Europe | 98.5 /100 | #98 | Exceptional $91,605 |
| Immigrants | South Eastern Asia | 98.4 /100 | #99 | Exceptional $91,541 |
| Ukrainians | 98.3 /100 | #100 | Exceptional $91,456 |
| Immigrants | Moldova | 98.3 /100 | #101 | Exceptional $91,446 |
| Austrians | 98.2 /100 | #102 | Exceptional $91,339 |
| Immigrants | Ukraine | 98.0 /100 | #103 | Exceptional $91,124 |
| Immigrants | Kazakhstan | 97.8 /100 | #104 | Exceptional $91,015 |
| Immigrants | Brazil | 97.7 /100 | #105 | Exceptional $90,907 |
| Macedonians | 97.4 /100 | #106 | Exceptional $90,761 |
| Croatians | 97.3 /100 | #107 | Exceptional $90,685 |
| Zimbabweans | 97.2 /100 | #108 | Exceptional $90,618 |
| Chileans | 97.2 /100 | #109 | Exceptional $90,605 |