Immigrants from Portugal vs Puerto Rican Median Male Earnings
COMPARE
Immigrants from Portugal
Puerto Rican
Median Male Earnings
Median Male Earnings Comparison
Immigrants from Portugal
Puerto Ricans
$55,182
MEDIAN MALE EARNINGS
66.3/ 100
METRIC RATING
165th/ 347
METRIC RANK
$40,071
MEDIAN MALE EARNINGS
0.0/ 100
METRIC RATING
345th/ 347
METRIC RANK
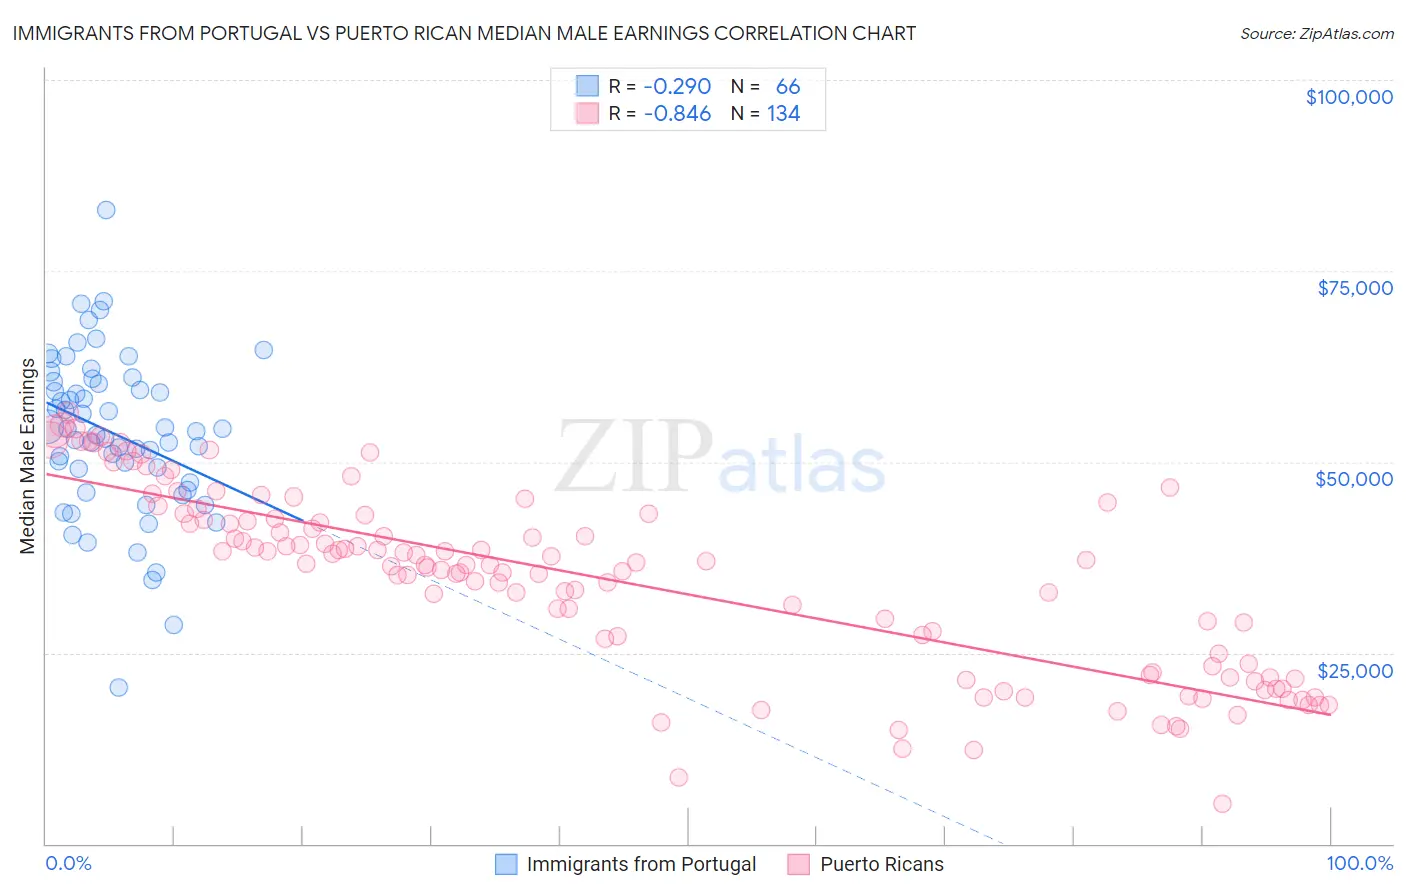
Immigrants from Portugal vs Puerto Rican Median Male Earnings Correlation Chart
The statistical analysis conducted on geographies consisting of 174,772,823 people shows a weak negative correlation between the proportion of Immigrants from Portugal and median male earnings in the United States with a correlation coefficient (R) of -0.290 and weighted average of $55,182. Similarly, the statistical analysis conducted on geographies consisting of 527,834,370 people shows a very strong negative correlation between the proportion of Puerto Ricans and median male earnings in the United States with a correlation coefficient (R) of -0.846 and weighted average of $40,071, a difference of 37.7%.
Median Male Earnings Correlation Summary
| Measurement | Immigrants from Portugal | Puerto Rican |
| Minimum | $20,417 | $5,183 |
| Maximum | $82,976 | $56,414 |
| Range | $62,559 | $51,231 |
| Mean | $53,702 | $34,723 |
| Median | $54,126 | $36,571 |
| Interquartile 25% (IQ1) | $47,334 | $23,294 |
| Interquartile 75% (IQ3) | $60,481 | $43,124 |
| Interquartile Range (IQR) | $13,147 | $19,830 |
| Standard Deviation (Sample) | $10,627 | $11,965 |
| Standard Deviation (Population) | $10,546 | $11,920 |
Similar Demographics by Median Male Earnings
Demographics Similar to Immigrants from Portugal by Median Male Earnings
In terms of median male earnings, the demographic groups most similar to Immigrants from Portugal are Immigrants from South Eastern Asia ($55,241, a difference of 0.11%), Ugandan ($55,290, a difference of 0.20%), French ($55,350, a difference of 0.31%), Belgian ($55,361, a difference of 0.32%), and Basque ($55,370, a difference of 0.34%).
| Demographics | Rating | Rank | Median Male Earnings |
| Czechoslovakians | 70.5 /100 | #158 | Good $55,382 |
| Alsatians | 70.5 /100 | #159 | Good $55,380 |
| Basques | 70.3 /100 | #160 | Good $55,370 |
| Belgians | 70.1 /100 | #161 | Good $55,361 |
| French | 69.9 /100 | #162 | Good $55,350 |
| Ugandans | 68.6 /100 | #163 | Good $55,290 |
| Immigrants | South Eastern Asia | 67.6 /100 | #164 | Good $55,241 |
| Immigrants | Portugal | 66.3 /100 | #165 | Good $55,182 |
| Germans | 61.6 /100 | #166 | Good $54,974 |
| Immigrants | Fiji | 61.2 /100 | #167 | Good $54,958 |
| Immigrants | Vietnam | 60.2 /100 | #168 | Good $54,913 |
| French Canadians | 55.6 /100 | #169 | Average $54,722 |
| Finns | 55.6 /100 | #170 | Average $54,721 |
| Immigrants | Peru | 54.9 /100 | #171 | Average $54,695 |
| Welsh | 53.8 /100 | #172 | Average $54,647 |
Demographics Similar to Puerto Ricans by Median Male Earnings
In terms of median male earnings, the demographic groups most similar to Puerto Ricans are Tohono O'odham ($39,543, a difference of 1.3%), Yup'ik ($39,504, a difference of 1.4%), Pueblo ($41,314, a difference of 3.1%), Lumbee ($41,715, a difference of 4.1%), and Arapaho ($41,758, a difference of 4.2%).
| Demographics | Rating | Rank | Median Male Earnings |
| Immigrants | Congo | 0.0 /100 | #333 | Tragic $44,204 |
| Immigrants | Yemen | 0.0 /100 | #334 | Tragic $44,083 |
| Spanish American Indians | 0.0 /100 | #335 | Tragic $44,010 |
| Immigrants | Cuba | 0.0 /100 | #336 | Tragic $43,461 |
| Menominee | 0.0 /100 | #337 | Tragic $42,581 |
| Crow | 0.0 /100 | #338 | Tragic $42,434 |
| Pima | 0.0 /100 | #339 | Tragic $42,357 |
| Navajo | 0.0 /100 | #340 | Tragic $42,098 |
| Hopi | 0.0 /100 | #341 | Tragic $42,060 |
| Arapaho | 0.0 /100 | #342 | Tragic $41,758 |
| Lumbee | 0.0 /100 | #343 | Tragic $41,715 |
| Pueblo | 0.0 /100 | #344 | Tragic $41,314 |
| Puerto Ricans | 0.0 /100 | #345 | Tragic $40,071 |
| Tohono O'odham | 0.0 /100 | #346 | Tragic $39,543 |
| Yup'ik | 0.0 /100 | #347 | Tragic $39,504 |