Austrian vs Senegalese Householder Income Ages 25 - 44 years
COMPARE
Austrian
Senegalese
Householder Income Ages 25 - 44 years
Householder Income Ages 25 - 44 years Comparison
Austrians
Senegalese
$101,842
HOUSEHOLDER INCOME AGES 25 - 44 YEARS
98.3/ 100
METRIC RATING
97th/ 347
METRIC RANK
$82,852
HOUSEHOLDER INCOME AGES 25 - 44 YEARS
0.2/ 100
METRIC RATING
278th/ 347
METRIC RANK
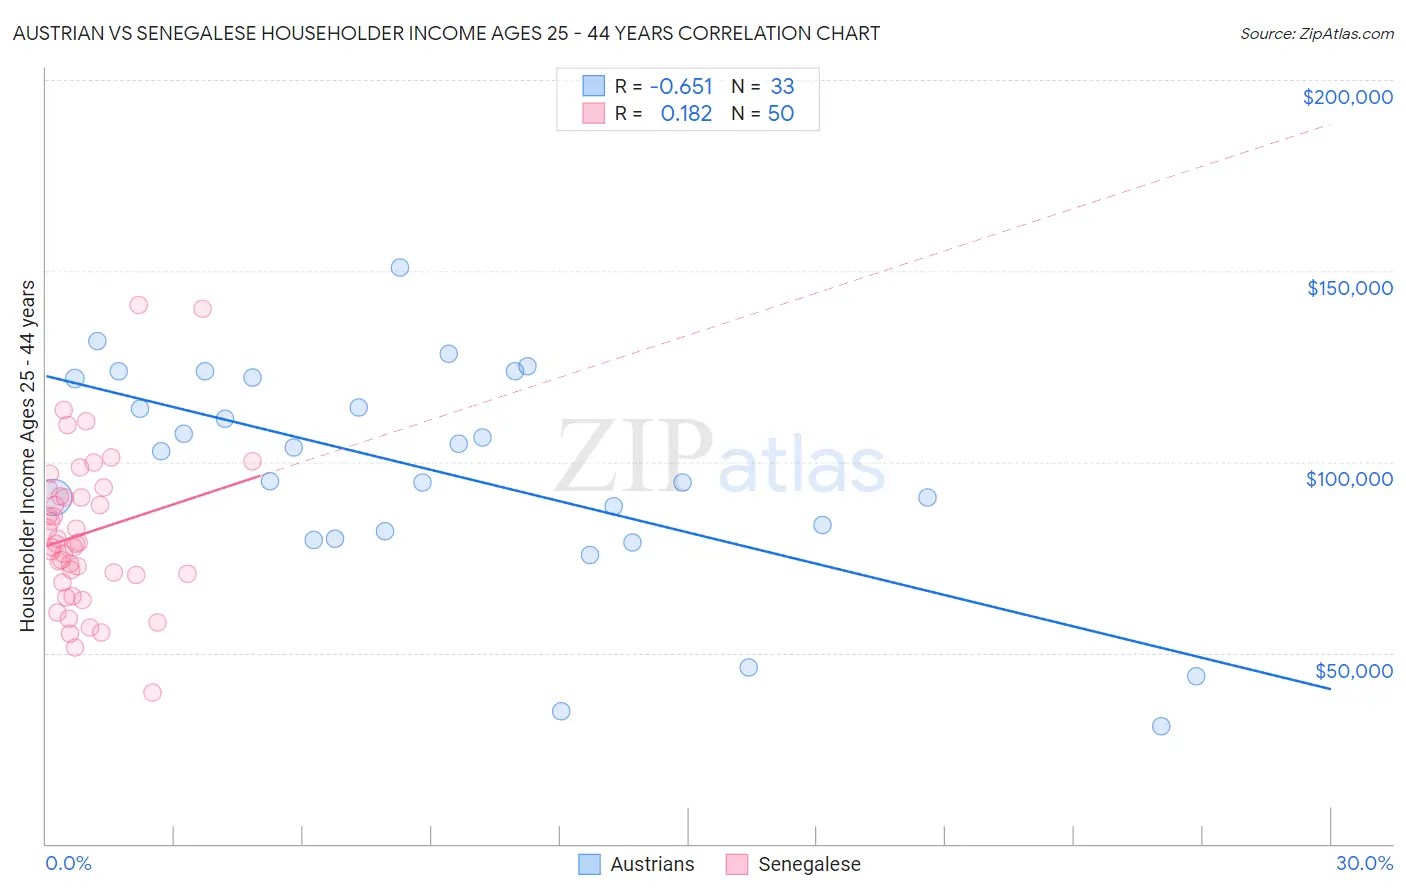
Austrian vs Senegalese Householder Income Ages 25 - 44 years Correlation Chart
The statistical analysis conducted on geographies consisting of 450,333,214 people shows a significant negative correlation between the proportion of Austrians and household income with householder between the ages 25 and 44 in the United States with a correlation coefficient (R) of -0.651 and weighted average of $101,842. Similarly, the statistical analysis conducted on geographies consisting of 78,048,769 people shows a poor positive correlation between the proportion of Senegalese and household income with householder between the ages 25 and 44 in the United States with a correlation coefficient (R) of 0.182 and weighted average of $82,852, a difference of 22.9%.
Householder Income Ages 25 - 44 years Correlation Summary
| Measurement | Austrian | Senegalese |
| Minimum | $30,750 | $39,688 |
| Maximum | $150,833 | $141,023 |
| Range | $120,083 | $101,335 |
| Mean | $97,065 | $81,327 |
| Median | $102,890 | $78,521 |
| Interquartile 25% (IQ1) | $80,830 | $70,437 |
| Interquartile 75% (IQ3) | $121,881 | $90,994 |
| Interquartile Range (IQR) | $41,051 | $20,557 |
| Standard Deviation (Sample) | $28,521 | $20,178 |
| Standard Deviation (Population) | $28,086 | $19,975 |
Similar Demographics by Householder Income Ages 25 - 44 years
Demographics Similar to Austrians by Householder Income Ages 25 - 44 years
In terms of householder income ages 25 - 44 years, the demographic groups most similar to Austrians are Macedonian ($101,882, a difference of 0.040%), Assyrian/Chaldean/Syriac ($101,936, a difference of 0.090%), Immigrants from Kazakhstan ($101,727, a difference of 0.11%), Sri Lankan ($101,960, a difference of 0.12%), and Immigrants from England ($102,020, a difference of 0.17%).
| Demographics | Rating | Rank | Householder Income Ages 25 - 44 years |
| Ukrainians | 98.8 /100 | #90 | Exceptional $102,451 |
| Croatians | 98.7 /100 | #91 | Exceptional $102,414 |
| Immigrants | North America | 98.7 /100 | #92 | Exceptional $102,407 |
| Immigrants | England | 98.4 /100 | #93 | Exceptional $102,020 |
| Sri Lankans | 98.4 /100 | #94 | Exceptional $101,960 |
| Assyrians/Chaldeans/Syriacs | 98.3 /100 | #95 | Exceptional $101,936 |
| Macedonians | 98.3 /100 | #96 | Exceptional $101,882 |
| Austrians | 98.3 /100 | #97 | Exceptional $101,842 |
| Immigrants | Kazakhstan | 98.1 /100 | #98 | Exceptional $101,727 |
| Taiwanese | 97.9 /100 | #99 | Exceptional $101,492 |
| Immigrants | Argentina | 97.8 /100 | #100 | Exceptional $101,415 |
| Albanians | 97.8 /100 | #101 | Exceptional $101,367 |
| Immigrants | Lebanon | 97.4 /100 | #102 | Exceptional $101,124 |
| Immigrants | Moldova | 97.4 /100 | #103 | Exceptional $101,091 |
| Immigrants | Poland | 97.4 /100 | #104 | Exceptional $101,065 |
Demographics Similar to Senegalese by Householder Income Ages 25 - 44 years
In terms of householder income ages 25 - 44 years, the demographic groups most similar to Senegalese are Pima ($82,821, a difference of 0.040%), Paiute ($82,984, a difference of 0.16%), Colville ($82,604, a difference of 0.30%), Immigrants from Belize ($83,141, a difference of 0.35%), and Immigrants from Jamaica ($83,298, a difference of 0.54%).
| Demographics | Rating | Rank | Householder Income Ages 25 - 44 years |
| Somalis | 0.2 /100 | #271 | Tragic $83,752 |
| Spanish Americans | 0.2 /100 | #272 | Tragic $83,722 |
| Iroquois | 0.2 /100 | #273 | Tragic $83,682 |
| Marshallese | 0.2 /100 | #274 | Tragic $83,575 |
| Immigrants | Jamaica | 0.2 /100 | #275 | Tragic $83,298 |
| Immigrants | Belize | 0.2 /100 | #276 | Tragic $83,141 |
| Paiute | 0.2 /100 | #277 | Tragic $82,984 |
| Senegalese | 0.2 /100 | #278 | Tragic $82,852 |
| Pima | 0.1 /100 | #279 | Tragic $82,821 |
| Colville | 0.1 /100 | #280 | Tragic $82,604 |
| Cajuns | 0.1 /100 | #281 | Tragic $82,393 |
| Central American Indians | 0.1 /100 | #282 | Tragic $82,355 |
| Guatemalans | 0.1 /100 | #283 | Tragic $82,331 |
| Immigrants | Middle Africa | 0.1 /100 | #284 | Tragic $82,254 |
| Immigrants | Somalia | 0.1 /100 | #285 | Tragic $82,188 |