Guyanese vs Hopi Householder Income Ages 25 - 44 years
COMPARE
Guyanese
Hopi
Householder Income Ages 25 - 44 years
Householder Income Ages 25 - 44 years Comparison
Guyanese
Hopi
$89,940
HOUSEHOLDER INCOME AGES 25 - 44 YEARS
7.1/ 100
METRIC RATING
218th/ 347
METRIC RANK
$75,002
HOUSEHOLDER INCOME AGES 25 - 44 YEARS
0.0/ 100
METRIC RATING
333rd/ 347
METRIC RANK
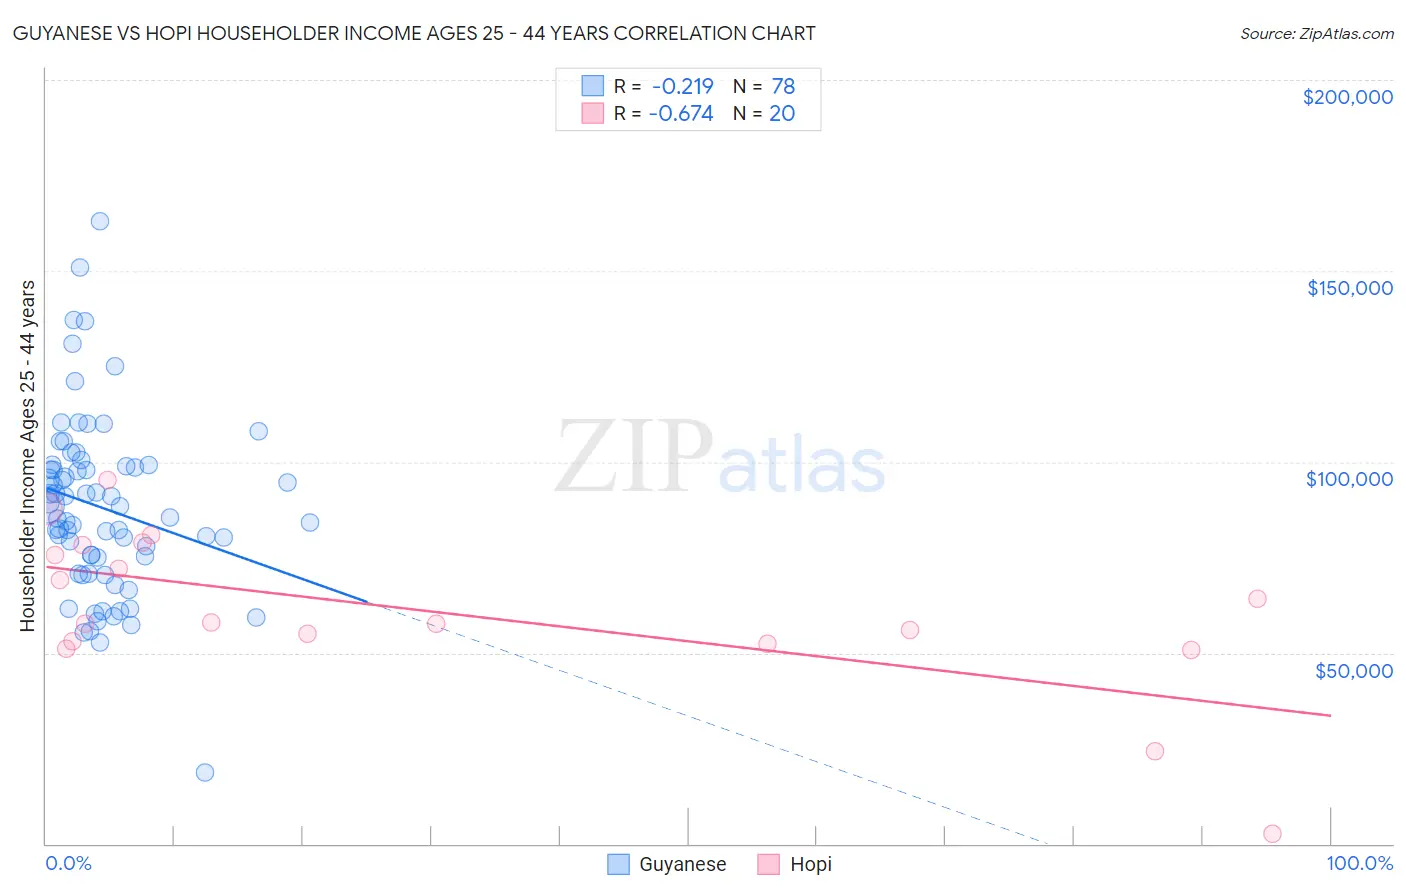
Guyanese vs Hopi Householder Income Ages 25 - 44 years Correlation Chart
The statistical analysis conducted on geographies consisting of 176,637,436 people shows a weak negative correlation between the proportion of Guyanese and household income with householder between the ages 25 and 44 in the United States with a correlation coefficient (R) of -0.219 and weighted average of $89,940. Similarly, the statistical analysis conducted on geographies consisting of 74,668,880 people shows a significant negative correlation between the proportion of Hopi and household income with householder between the ages 25 and 44 in the United States with a correlation coefficient (R) of -0.674 and weighted average of $75,002, a difference of 19.9%.
Householder Income Ages 25 - 44 years Correlation Summary
| Measurement | Guyanese | Hopi |
| Minimum | $18,657 | $2,499 |
| Maximum | $163,166 | $95,278 |
| Range | $144,509 | $92,779 |
| Mean | $87,951 | $61,016 |
| Median | $86,958 | $57,812 |
| Interquartile 25% (IQ1) | $75,027 | $52,840 |
| Interquartile 75% (IQ3) | $98,879 | $76,984 |
| Interquartile Range (IQR) | $23,852 | $24,144 |
| Standard Deviation (Sample) | $23,398 | $21,159 |
| Standard Deviation (Population) | $23,248 | $20,623 |
Similar Demographics by Householder Income Ages 25 - 44 years
Demographics Similar to Guyanese by Householder Income Ages 25 - 44 years
In terms of householder income ages 25 - 44 years, the demographic groups most similar to Guyanese are Scotch-Irish ($89,969, a difference of 0.030%), Delaware ($89,876, a difference of 0.070%), Trinidadian and Tobagonian ($89,856, a difference of 0.090%), Immigrants from Trinidad and Tobago ($89,748, a difference of 0.21%), and Ghanaian ($90,137, a difference of 0.22%).
| Demographics | Rating | Rank | Householder Income Ages 25 - 44 years |
| Iraqis | 10.8 /100 | #211 | Poor $90,764 |
| Hawaiians | 10.6 /100 | #212 | Poor $90,722 |
| Immigrants | Bangladesh | 9.3 /100 | #213 | Tragic $90,448 |
| Immigrants | Africa | 8.9 /100 | #214 | Tragic $90,372 |
| Panamanians | 8.1 /100 | #215 | Tragic $90,193 |
| Ghanaians | 7.9 /100 | #216 | Tragic $90,137 |
| Scotch-Irish | 7.3 /100 | #217 | Tragic $89,969 |
| Guyanese | 7.1 /100 | #218 | Tragic $89,940 |
| Delaware | 6.9 /100 | #219 | Tragic $89,876 |
| Trinidadians and Tobagonians | 6.8 /100 | #220 | Tragic $89,856 |
| Immigrants | Trinidad and Tobago | 6.5 /100 | #221 | Tragic $89,748 |
| Immigrants | Ecuador | 6.2 /100 | #222 | Tragic $89,673 |
| Immigrants | Guyana | 5.9 /100 | #223 | Tragic $89,586 |
| Barbadians | 5.9 /100 | #224 | Tragic $89,565 |
| Immigrants | Panama | 5.5 /100 | #225 | Tragic $89,451 |
Demographics Similar to Hopi by Householder Income Ages 25 - 44 years
In terms of householder income ages 25 - 44 years, the demographic groups most similar to Hopi are Creek ($74,847, a difference of 0.21%), Kiowa ($74,776, a difference of 0.30%), Bahamian ($75,395, a difference of 0.52%), Native/Alaskan ($75,647, a difference of 0.86%), and Yakama ($76,226, a difference of 1.6%).
| Demographics | Rating | Rank | Householder Income Ages 25 - 44 years |
| Houma | 0.0 /100 | #326 | Tragic $77,044 |
| Immigrants | Bahamas | 0.0 /100 | #327 | Tragic $76,910 |
| Immigrants | Cuba | 0.0 /100 | #328 | Tragic $76,701 |
| Seminole | 0.0 /100 | #329 | Tragic $76,584 |
| Yakama | 0.0 /100 | #330 | Tragic $76,226 |
| Natives/Alaskans | 0.0 /100 | #331 | Tragic $75,647 |
| Bahamians | 0.0 /100 | #332 | Tragic $75,395 |
| Hopi | 0.0 /100 | #333 | Tragic $75,002 |
| Creek | 0.0 /100 | #334 | Tragic $74,847 |
| Kiowa | 0.0 /100 | #335 | Tragic $74,776 |
| Yup'ik | 0.0 /100 | #336 | Tragic $73,688 |
| Blacks/African Americans | 0.0 /100 | #337 | Tragic $73,370 |
| Immigrants | Yemen | 0.0 /100 | #338 | Tragic $73,043 |
| Yuman | 0.0 /100 | #339 | Tragic $72,956 |
| Immigrants | Congo | 0.0 /100 | #340 | Tragic $72,178 |