South African vs Hopi Householder Income Ages 25 - 44 years
COMPARE
South African
Hopi
Householder Income Ages 25 - 44 years
Householder Income Ages 25 - 44 years Comparison
South Africans
Hopi
$103,160
HOUSEHOLDER INCOME AGES 25 - 44 YEARS
99.2/ 100
METRIC RATING
81st/ 347
METRIC RANK
$75,002
HOUSEHOLDER INCOME AGES 25 - 44 YEARS
0.0/ 100
METRIC RATING
333rd/ 347
METRIC RANK
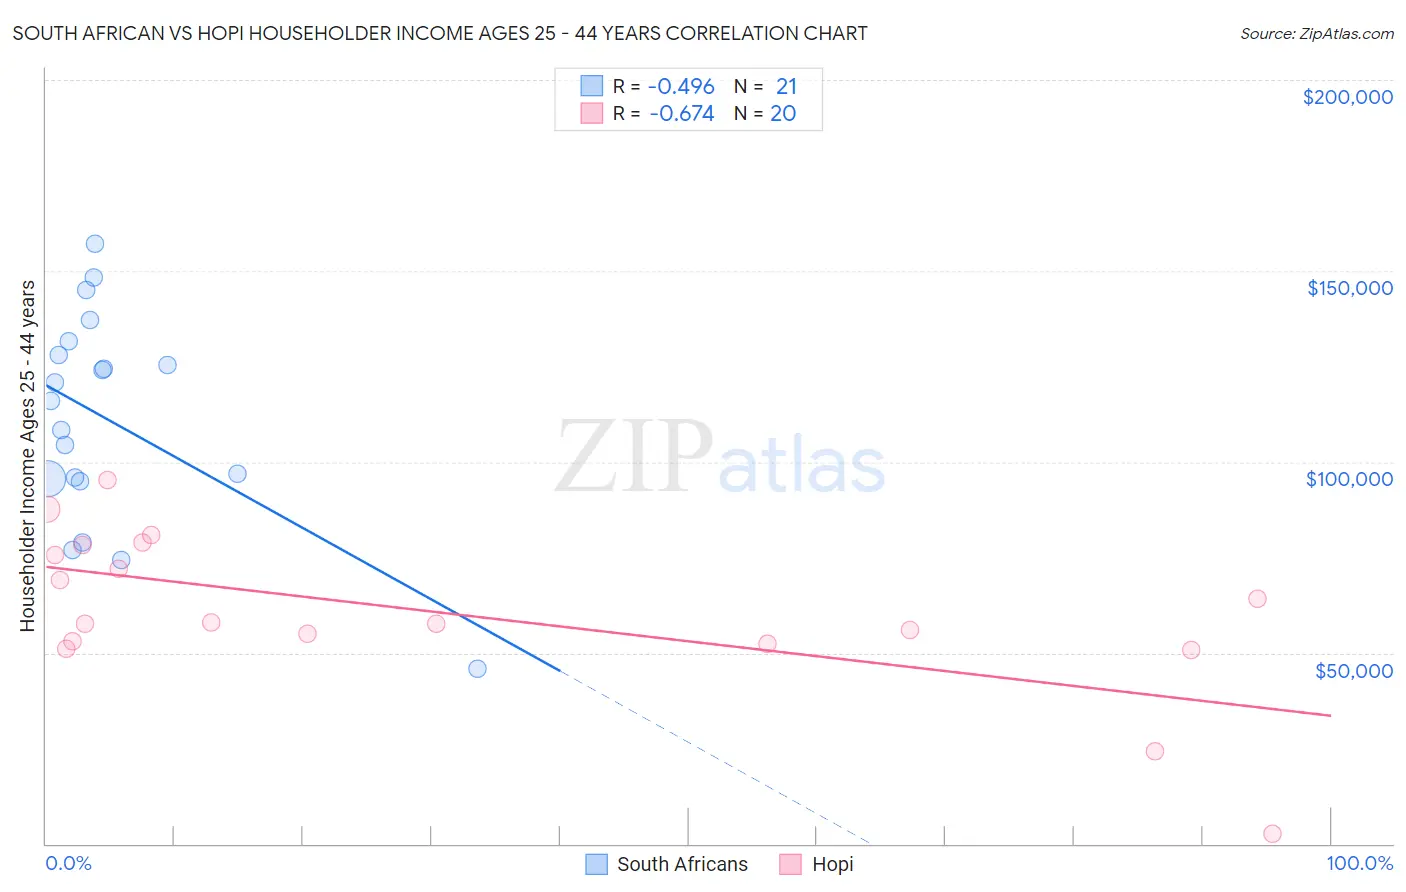
South African vs Hopi Householder Income Ages 25 - 44 years Correlation Chart
The statistical analysis conducted on geographies consisting of 182,377,934 people shows a moderate negative correlation between the proportion of South Africans and household income with householder between the ages 25 and 44 in the United States with a correlation coefficient (R) of -0.496 and weighted average of $103,160. Similarly, the statistical analysis conducted on geographies consisting of 74,668,880 people shows a significant negative correlation between the proportion of Hopi and household income with householder between the ages 25 and 44 in the United States with a correlation coefficient (R) of -0.674 and weighted average of $75,002, a difference of 37.5%.
Householder Income Ages 25 - 44 years Correlation Summary
| Measurement | South African | Hopi |
| Minimum | $45,714 | $2,499 |
| Maximum | $156,974 | $95,278 |
| Range | $111,260 | $92,779 |
| Mean | $110,921 | $61,016 |
| Median | $115,903 | $57,812 |
| Interquartile 25% (IQ1) | $95,265 | $52,840 |
| Interquartile 75% (IQ3) | $129,677 | $76,984 |
| Interquartile Range (IQR) | $34,411 | $24,144 |
| Standard Deviation (Sample) | $27,826 | $21,159 |
| Standard Deviation (Population) | $27,156 | $20,623 |
Similar Demographics by Householder Income Ages 25 - 44 years
Demographics Similar to South Africans by Householder Income Ages 25 - 44 years
In terms of householder income ages 25 - 44 years, the demographic groups most similar to South Africans are Immigrants from Serbia ($103,155, a difference of 0.010%), Immigrants from Egypt ($103,192, a difference of 0.030%), Argentinean ($103,111, a difference of 0.050%), Armenian ($103,248, a difference of 0.080%), and Immigrants from Philippines ($102,910, a difference of 0.24%).
| Demographics | Rating | Rank | Householder Income Ages 25 - 44 years |
| Immigrants | Fiji | 99.5 /100 | #74 | Exceptional $103,954 |
| Koreans | 99.4 /100 | #75 | Exceptional $103,824 |
| Immigrants | Spain | 99.4 /100 | #76 | Exceptional $103,752 |
| Immigrants | Southern Europe | 99.3 /100 | #77 | Exceptional $103,486 |
| Immigrants | Bulgaria | 99.3 /100 | #78 | Exceptional $103,423 |
| Armenians | 99.2 /100 | #79 | Exceptional $103,248 |
| Immigrants | Egypt | 99.2 /100 | #80 | Exceptional $103,192 |
| South Africans | 99.2 /100 | #81 | Exceptional $103,160 |
| Immigrants | Serbia | 99.2 /100 | #82 | Exceptional $103,155 |
| Argentineans | 99.1 /100 | #83 | Exceptional $103,111 |
| Immigrants | Philippines | 99.0 /100 | #84 | Exceptional $102,910 |
| Immigrants | Ukraine | 98.9 /100 | #85 | Exceptional $102,664 |
| Immigrants | Hungary | 98.9 /100 | #86 | Exceptional $102,655 |
| Immigrants | Western Europe | 98.9 /100 | #87 | Exceptional $102,654 |
| Immigrants | Canada | 98.9 /100 | #88 | Exceptional $102,616 |
Demographics Similar to Hopi by Householder Income Ages 25 - 44 years
In terms of householder income ages 25 - 44 years, the demographic groups most similar to Hopi are Creek ($74,847, a difference of 0.21%), Kiowa ($74,776, a difference of 0.30%), Bahamian ($75,395, a difference of 0.52%), Native/Alaskan ($75,647, a difference of 0.86%), and Yakama ($76,226, a difference of 1.6%).
| Demographics | Rating | Rank | Householder Income Ages 25 - 44 years |
| Houma | 0.0 /100 | #326 | Tragic $77,044 |
| Immigrants | Bahamas | 0.0 /100 | #327 | Tragic $76,910 |
| Immigrants | Cuba | 0.0 /100 | #328 | Tragic $76,701 |
| Seminole | 0.0 /100 | #329 | Tragic $76,584 |
| Yakama | 0.0 /100 | #330 | Tragic $76,226 |
| Natives/Alaskans | 0.0 /100 | #331 | Tragic $75,647 |
| Bahamians | 0.0 /100 | #332 | Tragic $75,395 |
| Hopi | 0.0 /100 | #333 | Tragic $75,002 |
| Creek | 0.0 /100 | #334 | Tragic $74,847 |
| Kiowa | 0.0 /100 | #335 | Tragic $74,776 |
| Yup'ik | 0.0 /100 | #336 | Tragic $73,688 |
| Blacks/African Americans | 0.0 /100 | #337 | Tragic $73,370 |
| Immigrants | Yemen | 0.0 /100 | #338 | Tragic $73,043 |
| Yuman | 0.0 /100 | #339 | Tragic $72,956 |
| Immigrants | Congo | 0.0 /100 | #340 | Tragic $72,178 |