Australian vs Immigrants from South Africa Householder Income Ages 25 - 44 years
COMPARE
Australian
Immigrants from South Africa
Householder Income Ages 25 - 44 years
Householder Income Ages 25 - 44 years Comparison
Australians
Immigrants from South Africa
$107,912
HOUSEHOLDER INCOME AGES 25 - 44 YEARS
99.9/ 100
METRIC RATING
42nd/ 347
METRIC RANK
$105,748
HOUSEHOLDER INCOME AGES 25 - 44 YEARS
99.8/ 100
METRIC RATING
58th/ 347
METRIC RANK
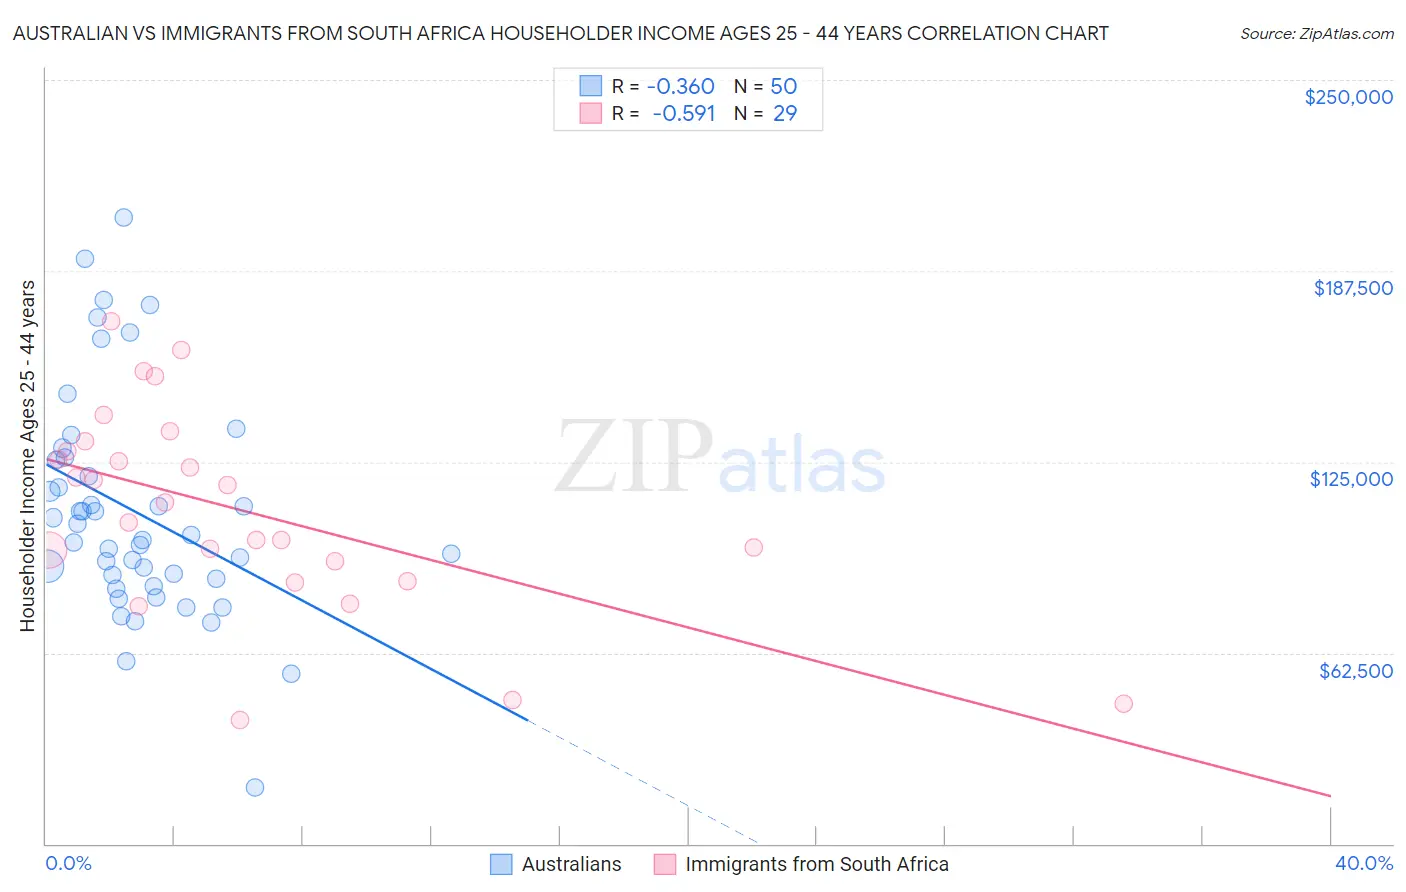
Australian vs Immigrants from South Africa Householder Income Ages 25 - 44 years Correlation Chart
The statistical analysis conducted on geographies consisting of 223,617,547 people shows a mild negative correlation between the proportion of Australians and household income with householder between the ages 25 and 44 in the United States with a correlation coefficient (R) of -0.360 and weighted average of $107,912. Similarly, the statistical analysis conducted on geographies consisting of 232,878,051 people shows a substantial negative correlation between the proportion of Immigrants from South Africa and household income with householder between the ages 25 and 44 in the United States with a correlation coefficient (R) of -0.591 and weighted average of $105,748, a difference of 2.1%.
Householder Income Ages 25 - 44 years Correlation Summary
| Measurement | Australian | Immigrants from South Africa |
| Minimum | $18,442 | $40,500 |
| Maximum | $205,156 | $171,037 |
| Range | $186,714 | $130,537 |
| Mean | $108,530 | $109,111 |
| Median | $100,349 | $111,695 |
| Interquartile 25% (IQ1) | $86,875 | $89,017 |
| Interquartile 75% (IQ3) | $125,544 | $130,136 |
| Interquartile Range (IQR) | $38,669 | $41,119 |
| Standard Deviation (Sample) | $36,623 | $33,105 |
| Standard Deviation (Population) | $36,255 | $32,529 |
Demographics Similar to Australians and Immigrants from South Africa by Householder Income Ages 25 - 44 years
In terms of householder income ages 25 - 44 years, the demographic groups most similar to Australians are Immigrants from Bolivia ($108,128, a difference of 0.20%), Immigrants from Lithuania ($108,149, a difference of 0.22%), Immigrants from Malaysia ($107,650, a difference of 0.24%), Immigrants from Indonesia ($107,627, a difference of 0.26%), and Israeli ($107,579, a difference of 0.31%). Similarly, the demographic groups most similar to Immigrants from South Africa are Immigrants from Latvia ($105,522, a difference of 0.21%), Immigrants from Austria ($106,103, a difference of 0.34%), Immigrants from Pakistan ($106,129, a difference of 0.36%), Egyptian ($105,282, a difference of 0.44%), and Greek ($106,457, a difference of 0.67%).
| Demographics | Rating | Rank | Householder Income Ages 25 - 44 years |
| Immigrants | Lithuania | 99.9 /100 | #40 | Exceptional $108,149 |
| Immigrants | Bolivia | 99.9 /100 | #41 | Exceptional $108,128 |
| Australians | 99.9 /100 | #42 | Exceptional $107,912 |
| Immigrants | Malaysia | 99.9 /100 | #43 | Exceptional $107,650 |
| Immigrants | Indonesia | 99.9 /100 | #44 | Exceptional $107,627 |
| Israelis | 99.9 /100 | #45 | Exceptional $107,579 |
| Immigrants | Belarus | 99.9 /100 | #46 | Exceptional $107,393 |
| Estonians | 99.9 /100 | #47 | Exceptional $107,269 |
| Bulgarians | 99.9 /100 | #48 | Exceptional $107,264 |
| Immigrants | Turkey | 99.9 /100 | #49 | Exceptional $107,258 |
| Cambodians | 99.9 /100 | #50 | Exceptional $107,148 |
| Immigrants | Czechoslovakia | 99.9 /100 | #51 | Exceptional $106,888 |
| Immigrants | Europe | 99.9 /100 | #52 | Exceptional $106,817 |
| Immigrants | Norway | 99.9 /100 | #53 | Exceptional $106,629 |
| Paraguayans | 99.9 /100 | #54 | Exceptional $106,615 |
| Greeks | 99.9 /100 | #55 | Exceptional $106,457 |
| Immigrants | Pakistan | 99.8 /100 | #56 | Exceptional $106,129 |
| Immigrants | Austria | 99.8 /100 | #57 | Exceptional $106,103 |
| Immigrants | South Africa | 99.8 /100 | #58 | Exceptional $105,748 |
| Immigrants | Latvia | 99.8 /100 | #59 | Exceptional $105,522 |
| Egyptians | 99.7 /100 | #60 | Exceptional $105,282 |