Australian vs Immigrants from Hong Kong Householder Income Ages 25 - 44 years
COMPARE
Australian
Immigrants from Hong Kong
Householder Income Ages 25 - 44 years
Householder Income Ages 25 - 44 years Comparison
Australians
Immigrants from Hong Kong
$107,912
HOUSEHOLDER INCOME AGES 25 - 44 YEARS
99.9/ 100
METRIC RATING
42nd/ 347
METRIC RANK
$128,140
HOUSEHOLDER INCOME AGES 25 - 44 YEARS
100.0/ 100
METRIC RATING
3rd/ 347
METRIC RANK
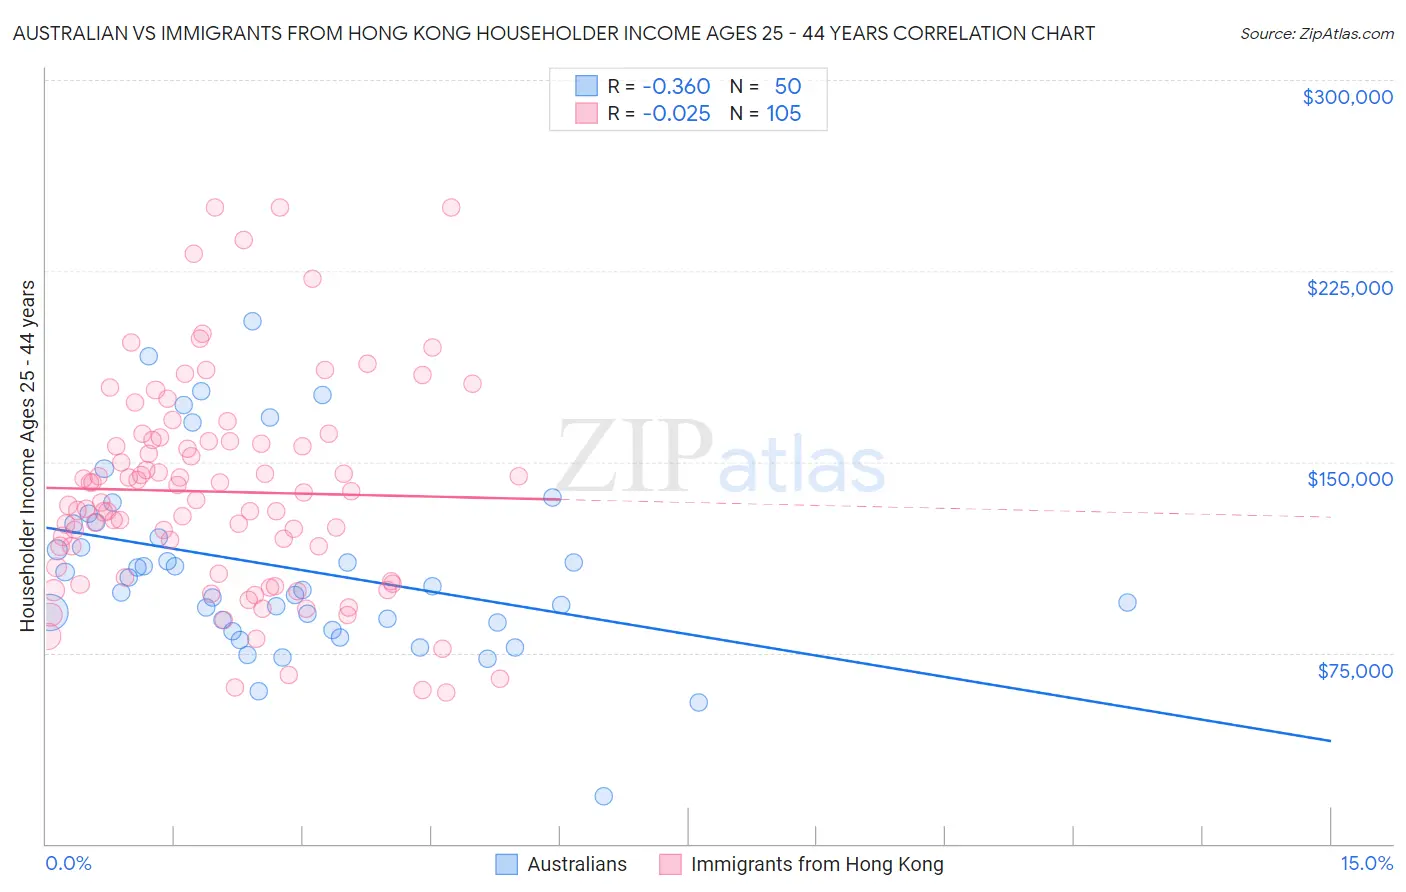
Australian vs Immigrants from Hong Kong Householder Income Ages 25 - 44 years Correlation Chart
The statistical analysis conducted on geographies consisting of 223,617,547 people shows a mild negative correlation between the proportion of Australians and household income with householder between the ages 25 and 44 in the United States with a correlation coefficient (R) of -0.360 and weighted average of $107,912. Similarly, the statistical analysis conducted on geographies consisting of 253,525,786 people shows no correlation between the proportion of Immigrants from Hong Kong and household income with householder between the ages 25 and 44 in the United States with a correlation coefficient (R) of -0.025 and weighted average of $128,140, a difference of 18.7%.
Householder Income Ages 25 - 44 years Correlation Summary
| Measurement | Australian | Immigrants from Hong Kong |
| Minimum | $18,442 | $59,375 |
| Maximum | $205,156 | $250,001 |
| Range | $186,714 | $190,626 |
| Mean | $108,530 | $138,260 |
| Median | $100,349 | $135,232 |
| Interquartile 25% (IQ1) | $86,875 | $105,327 |
| Interquartile 75% (IQ3) | $125,544 | $158,212 |
| Interquartile Range (IQR) | $38,669 | $52,885 |
| Standard Deviation (Sample) | $36,623 | $41,494 |
| Standard Deviation (Population) | $36,255 | $41,296 |
Similar Demographics by Householder Income Ages 25 - 44 years
Demographics Similar to Australians by Householder Income Ages 25 - 44 years
In terms of householder income ages 25 - 44 years, the demographic groups most similar to Australians are Immigrants from Bolivia ($108,128, a difference of 0.20%), Immigrants from Lithuania ($108,149, a difference of 0.22%), Immigrants from Malaysia ($107,650, a difference of 0.24%), Immigrants from Indonesia ($107,627, a difference of 0.26%), and Israeli ($107,579, a difference of 0.31%).
| Demographics | Rating | Rank | Householder Income Ages 25 - 44 years |
| Immigrants | Switzerland | 100.0 /100 | #35 | Exceptional $109,185 |
| Latvians | 100.0 /100 | #36 | Exceptional $108,926 |
| Immigrants | Russia | 100.0 /100 | #37 | Exceptional $108,751 |
| Soviet Union | 100.0 /100 | #38 | Exceptional $108,457 |
| Immigrants | France | 99.9 /100 | #39 | Exceptional $108,257 |
| Immigrants | Lithuania | 99.9 /100 | #40 | Exceptional $108,149 |
| Immigrants | Bolivia | 99.9 /100 | #41 | Exceptional $108,128 |
| Australians | 99.9 /100 | #42 | Exceptional $107,912 |
| Immigrants | Malaysia | 99.9 /100 | #43 | Exceptional $107,650 |
| Immigrants | Indonesia | 99.9 /100 | #44 | Exceptional $107,627 |
| Israelis | 99.9 /100 | #45 | Exceptional $107,579 |
| Immigrants | Belarus | 99.9 /100 | #46 | Exceptional $107,393 |
| Estonians | 99.9 /100 | #47 | Exceptional $107,269 |
| Bulgarians | 99.9 /100 | #48 | Exceptional $107,264 |
| Immigrants | Turkey | 99.9 /100 | #49 | Exceptional $107,258 |
Demographics Similar to Immigrants from Hong Kong by Householder Income Ages 25 - 44 years
In terms of householder income ages 25 - 44 years, the demographic groups most similar to Immigrants from Hong Kong are Filipino ($128,723, a difference of 0.45%), Immigrants from Taiwan ($129,122, a difference of 0.77%), Immigrants from Singapore ($124,429, a difference of 3.0%), Immigrants from India ($124,238, a difference of 3.1%), and Thai ($121,778, a difference of 5.2%).
| Demographics | Rating | Rank | Householder Income Ages 25 - 44 years |
| Immigrants | Taiwan | 100.0 /100 | #1 | Exceptional $129,122 |
| Filipinos | 100.0 /100 | #2 | Exceptional $128,723 |
| Immigrants | Hong Kong | 100.0 /100 | #3 | Exceptional $128,140 |
| Immigrants | Singapore | 100.0 /100 | #4 | Exceptional $124,429 |
| Immigrants | India | 100.0 /100 | #5 | Exceptional $124,238 |
| Thais | 100.0 /100 | #6 | Exceptional $121,778 |
| Immigrants | Ireland | 100.0 /100 | #7 | Exceptional $120,333 |
| Iranians | 100.0 /100 | #8 | Exceptional $120,292 |
| Immigrants | China | 100.0 /100 | #9 | Exceptional $119,756 |
| Indians (Asian) | 100.0 /100 | #10 | Exceptional $119,496 |
| Okinawans | 100.0 /100 | #11 | Exceptional $119,349 |
| Immigrants | Iran | 100.0 /100 | #12 | Exceptional $119,204 |
| Immigrants | Eastern Asia | 100.0 /100 | #13 | Exceptional $118,056 |
| Immigrants | Israel | 100.0 /100 | #14 | Exceptional $117,219 |
| Immigrants | South Central Asia | 100.0 /100 | #15 | Exceptional $116,626 |