West Indian vs Immigrants from South Africa Householder Income Ages 25 - 44 years
COMPARE
West Indian
Immigrants from South Africa
Householder Income Ages 25 - 44 years
Householder Income Ages 25 - 44 years Comparison
West Indians
Immigrants from South Africa
$87,205
HOUSEHOLDER INCOME AGES 25 - 44 YEARS
1.7/ 100
METRIC RATING
242nd/ 347
METRIC RANK
$105,748
HOUSEHOLDER INCOME AGES 25 - 44 YEARS
99.8/ 100
METRIC RATING
58th/ 347
METRIC RANK
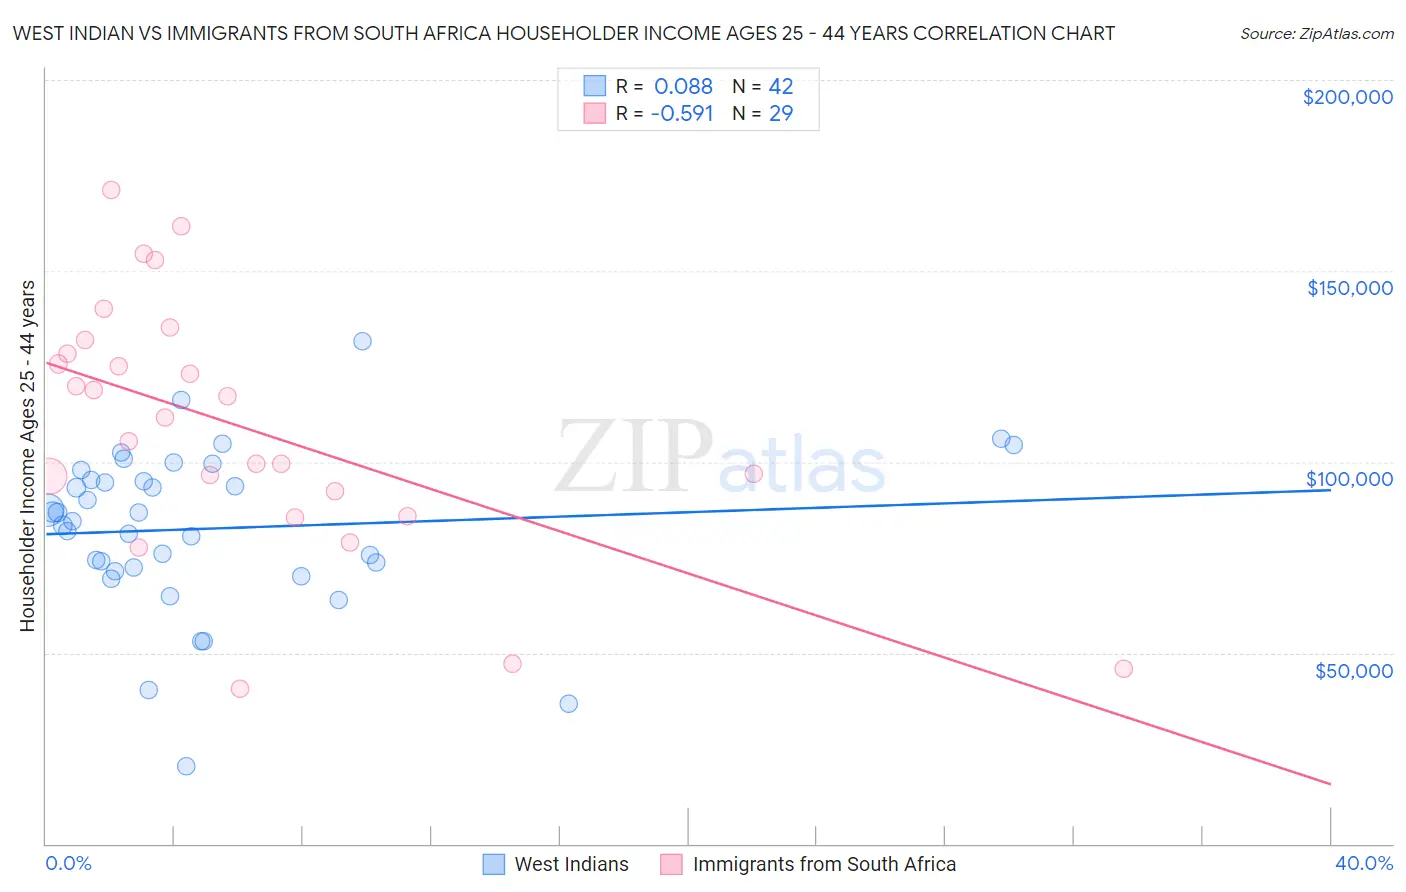
West Indian vs Immigrants from South Africa Householder Income Ages 25 - 44 years Correlation Chart
The statistical analysis conducted on geographies consisting of 253,630,243 people shows a slight positive correlation between the proportion of West Indians and household income with householder between the ages 25 and 44 in the United States with a correlation coefficient (R) of 0.088 and weighted average of $87,205. Similarly, the statistical analysis conducted on geographies consisting of 232,878,051 people shows a substantial negative correlation between the proportion of Immigrants from South Africa and household income with householder between the ages 25 and 44 in the United States with a correlation coefficient (R) of -0.591 and weighted average of $105,748, a difference of 21.3%.
Householder Income Ages 25 - 44 years Correlation Summary
| Measurement | West Indian | Immigrants from South Africa |
| Minimum | $20,234 | $40,500 |
| Maximum | $131,705 | $171,037 |
| Range | $111,471 | $130,537 |
| Mean | $82,528 | $109,111 |
| Median | $85,571 | $111,695 |
| Interquartile 25% (IQ1) | $72,417 | $89,017 |
| Interquartile 75% (IQ3) | $95,404 | $130,136 |
| Interquartile Range (IQR) | $22,987 | $41,119 |
| Standard Deviation (Sample) | $21,318 | $33,105 |
| Standard Deviation (Population) | $21,063 | $32,529 |
Similar Demographics by Householder Income Ages 25 - 44 years
Demographics Similar to West Indians by Householder Income Ages 25 - 44 years
In terms of householder income ages 25 - 44 years, the demographic groups most similar to West Indians are Immigrants from West Indies ($87,063, a difference of 0.16%), Immigrants from Venezuela ($87,038, a difference of 0.19%), Immigrants from El Salvador ($86,913, a difference of 0.34%), Immigrants from Burma/Myanmar ($86,736, a difference of 0.54%), and Nigerian ($87,730, a difference of 0.60%).
| Demographics | Rating | Rank | Householder Income Ages 25 - 44 years |
| Bermudans | 2.9 /100 | #235 | Tragic $88,231 |
| Immigrants | Cameroon | 2.9 /100 | #236 | Tragic $88,214 |
| Salvadorans | 2.8 /100 | #237 | Tragic $88,198 |
| Alaska Natives | 2.6 /100 | #238 | Tragic $88,018 |
| Immigrants | Ghana | 2.2 /100 | #239 | Tragic $87,760 |
| Nicaraguans | 2.2 /100 | #240 | Tragic $87,751 |
| Nigerians | 2.2 /100 | #241 | Tragic $87,730 |
| West Indians | 1.7 /100 | #242 | Tragic $87,205 |
| Immigrants | West Indies | 1.5 /100 | #243 | Tragic $87,063 |
| Immigrants | Venezuela | 1.5 /100 | #244 | Tragic $87,038 |
| Immigrants | El Salvador | 1.4 /100 | #245 | Tragic $86,913 |
| Immigrants | Burma/Myanmar | 1.3 /100 | #246 | Tragic $86,736 |
| Immigrants | Nigeria | 1.2 /100 | #247 | Tragic $86,589 |
| Immigrants | Sudan | 0.9 /100 | #248 | Tragic $86,109 |
| French American Indians | 0.8 /100 | #249 | Tragic $85,899 |
Demographics Similar to Immigrants from South Africa by Householder Income Ages 25 - 44 years
In terms of householder income ages 25 - 44 years, the demographic groups most similar to Immigrants from South Africa are Immigrants from Latvia ($105,522, a difference of 0.21%), Immigrants from Austria ($106,103, a difference of 0.34%), Immigrants from Pakistan ($106,129, a difference of 0.36%), Egyptian ($105,282, a difference of 0.44%), and Lithuanian ($105,223, a difference of 0.50%).
| Demographics | Rating | Rank | Householder Income Ages 25 - 44 years |
| Immigrants | Czechoslovakia | 99.9 /100 | #51 | Exceptional $106,888 |
| Immigrants | Europe | 99.9 /100 | #52 | Exceptional $106,817 |
| Immigrants | Norway | 99.9 /100 | #53 | Exceptional $106,629 |
| Paraguayans | 99.9 /100 | #54 | Exceptional $106,615 |
| Greeks | 99.9 /100 | #55 | Exceptional $106,457 |
| Immigrants | Pakistan | 99.8 /100 | #56 | Exceptional $106,129 |
| Immigrants | Austria | 99.8 /100 | #57 | Exceptional $106,103 |
| Immigrants | South Africa | 99.8 /100 | #58 | Exceptional $105,748 |
| Immigrants | Latvia | 99.8 /100 | #59 | Exceptional $105,522 |
| Egyptians | 99.7 /100 | #60 | Exceptional $105,282 |
| Lithuanians | 99.7 /100 | #61 | Exceptional $105,223 |
| Immigrants | Italy | 99.7 /100 | #62 | Exceptional $105,201 |
| Immigrants | Scotland | 99.7 /100 | #63 | Exceptional $105,089 |
| New Zealanders | 99.7 /100 | #64 | Exceptional $105,085 |
| Immigrants | Netherlands | 99.7 /100 | #65 | Exceptional $105,082 |