Australian vs Marshallese Householder Income Ages 25 - 44 years
COMPARE
Australian
Marshallese
Householder Income Ages 25 - 44 years
Householder Income Ages 25 - 44 years Comparison
Australians
Marshallese
$107,912
HOUSEHOLDER INCOME AGES 25 - 44 YEARS
99.9/ 100
METRIC RATING
42nd/ 347
METRIC RANK
$83,575
HOUSEHOLDER INCOME AGES 25 - 44 YEARS
0.2/ 100
METRIC RATING
274th/ 347
METRIC RANK
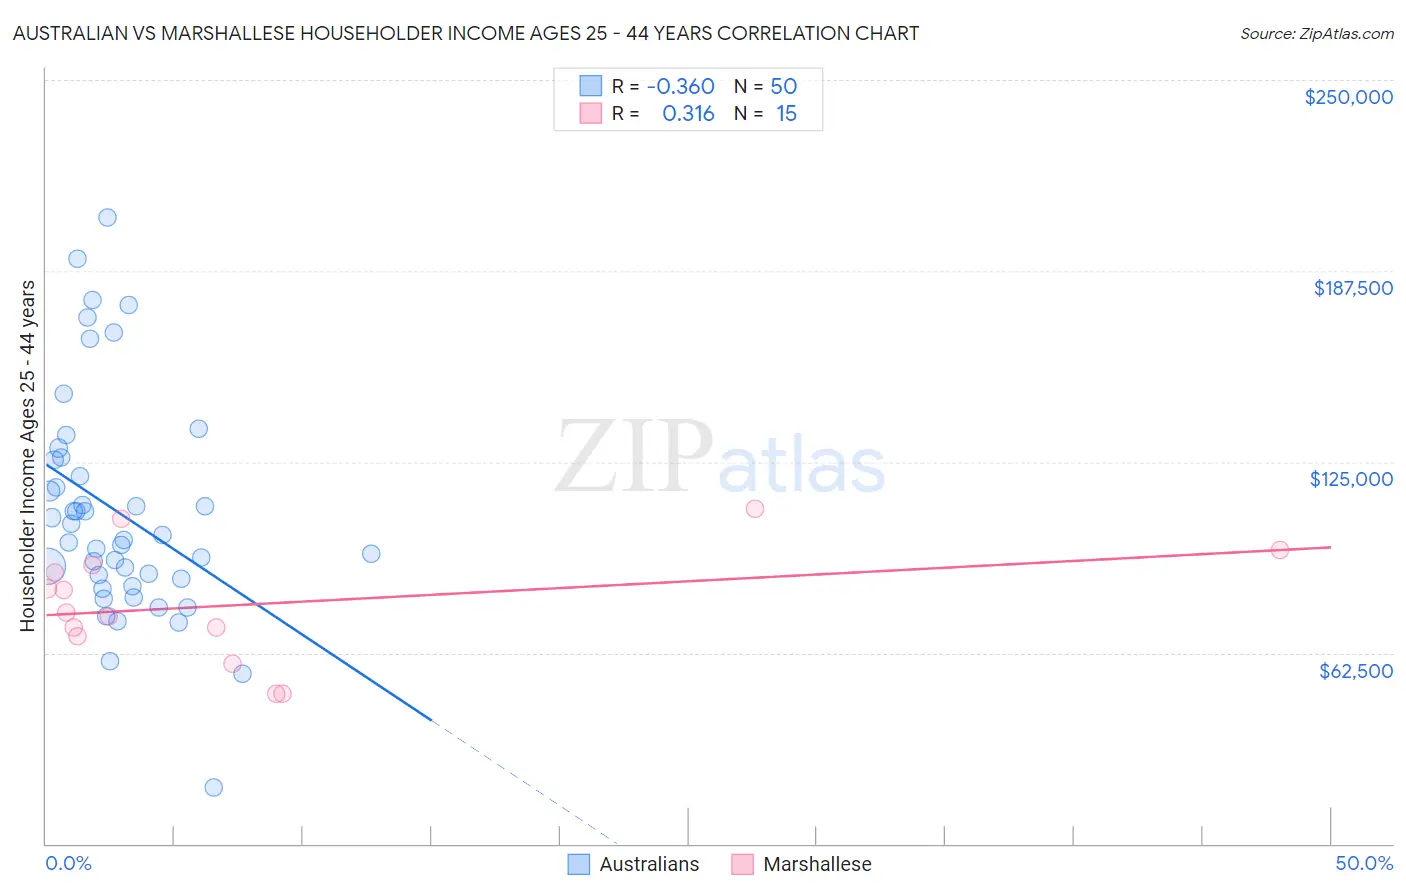
Australian vs Marshallese Householder Income Ages 25 - 44 years Correlation Chart
The statistical analysis conducted on geographies consisting of 223,617,547 people shows a mild negative correlation between the proportion of Australians and household income with householder between the ages 25 and 44 in the United States with a correlation coefficient (R) of -0.360 and weighted average of $107,912. Similarly, the statistical analysis conducted on geographies consisting of 14,753,881 people shows a mild positive correlation between the proportion of Marshallese and household income with householder between the ages 25 and 44 in the United States with a correlation coefficient (R) of 0.316 and weighted average of $83,575, a difference of 29.1%.
Householder Income Ages 25 - 44 years Correlation Summary
| Measurement | Australian | Marshallese |
| Minimum | $18,442 | $48,906 |
| Maximum | $205,156 | $109,583 |
| Range | $186,714 | $60,677 |
| Mean | $108,530 | $78,342 |
| Median | $100,349 | $75,712 |
| Interquartile 25% (IQ1) | $86,875 | $67,813 |
| Interquartile 75% (IQ3) | $125,544 | $91,124 |
| Interquartile Range (IQR) | $38,669 | $23,311 |
| Standard Deviation (Sample) | $36,623 | $18,418 |
| Standard Deviation (Population) | $36,255 | $17,794 |
Similar Demographics by Householder Income Ages 25 - 44 years
Demographics Similar to Australians by Householder Income Ages 25 - 44 years
In terms of householder income ages 25 - 44 years, the demographic groups most similar to Australians are Immigrants from Bolivia ($108,128, a difference of 0.20%), Immigrants from Lithuania ($108,149, a difference of 0.22%), Immigrants from Malaysia ($107,650, a difference of 0.24%), Immigrants from Indonesia ($107,627, a difference of 0.26%), and Israeli ($107,579, a difference of 0.31%).
| Demographics | Rating | Rank | Householder Income Ages 25 - 44 years |
| Immigrants | Switzerland | 100.0 /100 | #35 | Exceptional $109,185 |
| Latvians | 100.0 /100 | #36 | Exceptional $108,926 |
| Immigrants | Russia | 100.0 /100 | #37 | Exceptional $108,751 |
| Soviet Union | 100.0 /100 | #38 | Exceptional $108,457 |
| Immigrants | France | 99.9 /100 | #39 | Exceptional $108,257 |
| Immigrants | Lithuania | 99.9 /100 | #40 | Exceptional $108,149 |
| Immigrants | Bolivia | 99.9 /100 | #41 | Exceptional $108,128 |
| Australians | 99.9 /100 | #42 | Exceptional $107,912 |
| Immigrants | Malaysia | 99.9 /100 | #43 | Exceptional $107,650 |
| Immigrants | Indonesia | 99.9 /100 | #44 | Exceptional $107,627 |
| Israelis | 99.9 /100 | #45 | Exceptional $107,579 |
| Immigrants | Belarus | 99.9 /100 | #46 | Exceptional $107,393 |
| Estonians | 99.9 /100 | #47 | Exceptional $107,269 |
| Bulgarians | 99.9 /100 | #48 | Exceptional $107,264 |
| Immigrants | Turkey | 99.9 /100 | #49 | Exceptional $107,258 |
Demographics Similar to Marshallese by Householder Income Ages 25 - 44 years
In terms of householder income ages 25 - 44 years, the demographic groups most similar to Marshallese are Iroquois ($83,682, a difference of 0.13%), Spanish American ($83,722, a difference of 0.18%), Somali ($83,752, a difference of 0.21%), Immigrants from Jamaica ($83,298, a difference of 0.33%), and Jamaican ($83,933, a difference of 0.43%).
| Demographics | Rating | Rank | Householder Income Ages 25 - 44 years |
| Hmong | 0.3 /100 | #267 | Tragic $84,258 |
| Sub-Saharan Africans | 0.3 /100 | #268 | Tragic $84,235 |
| Spanish American Indians | 0.3 /100 | #269 | Tragic $84,085 |
| Jamaicans | 0.3 /100 | #270 | Tragic $83,933 |
| Somalis | 0.2 /100 | #271 | Tragic $83,752 |
| Spanish Americans | 0.2 /100 | #272 | Tragic $83,722 |
| Iroquois | 0.2 /100 | #273 | Tragic $83,682 |
| Marshallese | 0.2 /100 | #274 | Tragic $83,575 |
| Immigrants | Jamaica | 0.2 /100 | #275 | Tragic $83,298 |
| Immigrants | Belize | 0.2 /100 | #276 | Tragic $83,141 |
| Paiute | 0.2 /100 | #277 | Tragic $82,984 |
| Senegalese | 0.2 /100 | #278 | Tragic $82,852 |
| Pima | 0.1 /100 | #279 | Tragic $82,821 |
| Colville | 0.1 /100 | #280 | Tragic $82,604 |
| Cajuns | 0.1 /100 | #281 | Tragic $82,393 |