Immigrants from Sweden vs Immigrants from South Africa Householder Income Ages 25 - 44 years
COMPARE
Immigrants from Sweden
Immigrants from South Africa
Householder Income Ages 25 - 44 years
Householder Income Ages 25 - 44 years Comparison
Immigrants from Sweden
Immigrants from South Africa
$112,010
HOUSEHOLDER INCOME AGES 25 - 44 YEARS
100.0/ 100
METRIC RATING
24th/ 347
METRIC RANK
$105,748
HOUSEHOLDER INCOME AGES 25 - 44 YEARS
99.8/ 100
METRIC RATING
58th/ 347
METRIC RANK
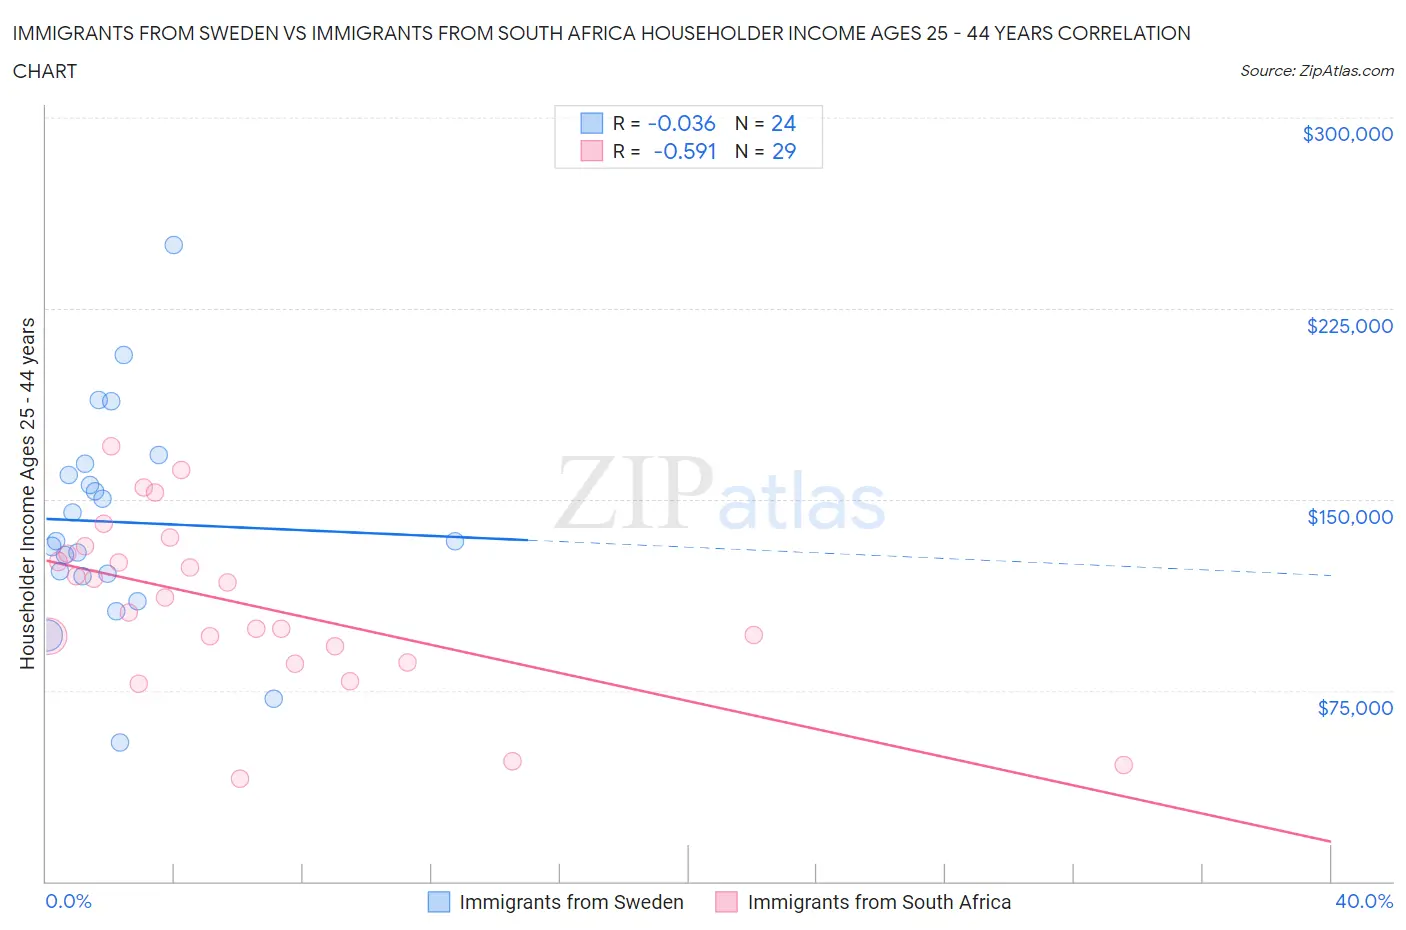
Immigrants from Sweden vs Immigrants from South Africa Householder Income Ages 25 - 44 years Correlation Chart
The statistical analysis conducted on geographies consisting of 164,402,876 people shows no correlation between the proportion of Immigrants from Sweden and household income with householder between the ages 25 and 44 in the United States with a correlation coefficient (R) of -0.036 and weighted average of $112,010. Similarly, the statistical analysis conducted on geographies consisting of 232,878,051 people shows a substantial negative correlation between the proportion of Immigrants from South Africa and household income with householder between the ages 25 and 44 in the United States with a correlation coefficient (R) of -0.591 and weighted average of $105,748, a difference of 5.9%.
Householder Income Ages 25 - 44 years Correlation Summary
| Measurement | Immigrants from Sweden | Immigrants from South Africa |
| Minimum | $54,583 | $40,500 |
| Maximum | $250,001 | $171,037 |
| Range | $195,418 | $130,537 |
| Mean | $141,082 | $109,111 |
| Median | $133,512 | $111,695 |
| Interquartile 25% (IQ1) | $120,320 | $89,017 |
| Interquartile 75% (IQ3) | $161,851 | $130,136 |
| Interquartile Range (IQR) | $41,531 | $41,119 |
| Standard Deviation (Sample) | $42,161 | $33,105 |
| Standard Deviation (Population) | $41,274 | $32,529 |
Similar Demographics by Householder Income Ages 25 - 44 years
Demographics Similar to Immigrants from Sweden by Householder Income Ages 25 - 44 years
In terms of householder income ages 25 - 44 years, the demographic groups most similar to Immigrants from Sweden are Immigrants from Japan ($112,228, a difference of 0.19%), Immigrants from Northern Europe ($111,676, a difference of 0.30%), Immigrants from Belgium ($112,575, a difference of 0.50%), Asian ($112,666, a difference of 0.59%), and Immigrants from Asia ($110,787, a difference of 1.1%).
| Demographics | Rating | Rank | Householder Income Ages 25 - 44 years |
| Immigrants | Australia | 100.0 /100 | #17 | Exceptional $115,947 |
| Eastern Europeans | 100.0 /100 | #18 | Exceptional $114,523 |
| Burmese | 100.0 /100 | #19 | Exceptional $113,701 |
| Immigrants | Korea | 100.0 /100 | #20 | Exceptional $113,401 |
| Asians | 100.0 /100 | #21 | Exceptional $112,666 |
| Immigrants | Belgium | 100.0 /100 | #22 | Exceptional $112,575 |
| Immigrants | Japan | 100.0 /100 | #23 | Exceptional $112,228 |
| Immigrants | Sweden | 100.0 /100 | #24 | Exceptional $112,010 |
| Immigrants | Northern Europe | 100.0 /100 | #25 | Exceptional $111,676 |
| Immigrants | Asia | 100.0 /100 | #26 | Exceptional $110,787 |
| Russians | 100.0 /100 | #27 | Exceptional $110,398 |
| Immigrants | Denmark | 100.0 /100 | #28 | Exceptional $110,363 |
| Turks | 100.0 /100 | #29 | Exceptional $110,318 |
| Immigrants | Greece | 100.0 /100 | #30 | Exceptional $110,103 |
| Maltese | 100.0 /100 | #31 | Exceptional $110,064 |
Demographics Similar to Immigrants from South Africa by Householder Income Ages 25 - 44 years
In terms of householder income ages 25 - 44 years, the demographic groups most similar to Immigrants from South Africa are Immigrants from Latvia ($105,522, a difference of 0.21%), Immigrants from Austria ($106,103, a difference of 0.34%), Immigrants from Pakistan ($106,129, a difference of 0.36%), Egyptian ($105,282, a difference of 0.44%), and Lithuanian ($105,223, a difference of 0.50%).
| Demographics | Rating | Rank | Householder Income Ages 25 - 44 years |
| Immigrants | Czechoslovakia | 99.9 /100 | #51 | Exceptional $106,888 |
| Immigrants | Europe | 99.9 /100 | #52 | Exceptional $106,817 |
| Immigrants | Norway | 99.9 /100 | #53 | Exceptional $106,629 |
| Paraguayans | 99.9 /100 | #54 | Exceptional $106,615 |
| Greeks | 99.9 /100 | #55 | Exceptional $106,457 |
| Immigrants | Pakistan | 99.8 /100 | #56 | Exceptional $106,129 |
| Immigrants | Austria | 99.8 /100 | #57 | Exceptional $106,103 |
| Immigrants | South Africa | 99.8 /100 | #58 | Exceptional $105,748 |
| Immigrants | Latvia | 99.8 /100 | #59 | Exceptional $105,522 |
| Egyptians | 99.7 /100 | #60 | Exceptional $105,282 |
| Lithuanians | 99.7 /100 | #61 | Exceptional $105,223 |
| Immigrants | Italy | 99.7 /100 | #62 | Exceptional $105,201 |
| Immigrants | Scotland | 99.7 /100 | #63 | Exceptional $105,089 |
| New Zealanders | 99.7 /100 | #64 | Exceptional $105,085 |
| Immigrants | Netherlands | 99.7 /100 | #65 | Exceptional $105,082 |