Australian vs French Canadian Householder Income Ages 25 - 44 years
COMPARE
Australian
French Canadian
Householder Income Ages 25 - 44 years
Householder Income Ages 25 - 44 years Comparison
Australians
French Canadians
$107,912
HOUSEHOLDER INCOME AGES 25 - 44 YEARS
99.9/ 100
METRIC RATING
42nd/ 347
METRIC RANK
$93,694
HOUSEHOLDER INCOME AGES 25 - 44 YEARS
38.2/ 100
METRIC RATING
179th/ 347
METRIC RANK
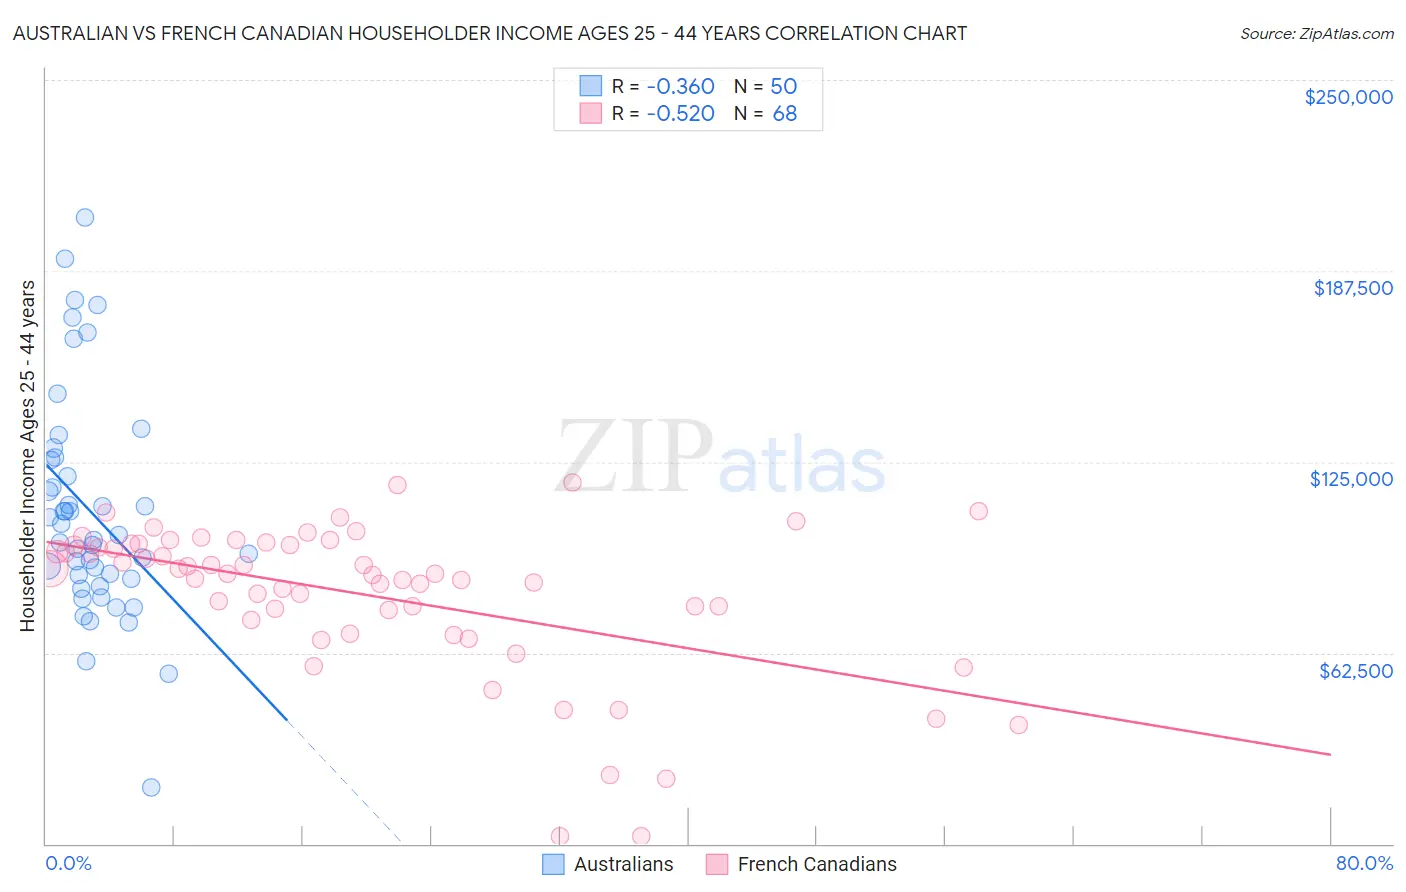
Australian vs French Canadian Householder Income Ages 25 - 44 years Correlation Chart
The statistical analysis conducted on geographies consisting of 223,617,547 people shows a mild negative correlation between the proportion of Australians and household income with householder between the ages 25 and 44 in the United States with a correlation coefficient (R) of -0.360 and weighted average of $107,912. Similarly, the statistical analysis conducted on geographies consisting of 499,836,876 people shows a substantial negative correlation between the proportion of French Canadians and household income with householder between the ages 25 and 44 in the United States with a correlation coefficient (R) of -0.520 and weighted average of $93,694, a difference of 15.2%.
Householder Income Ages 25 - 44 years Correlation Summary
| Measurement | Australian | French Canadian |
| Minimum | $18,442 | $2,499 |
| Maximum | $205,156 | $118,309 |
| Range | $186,714 | $115,810 |
| Mean | $108,530 | $81,603 |
| Median | $100,349 | $88,389 |
| Interquartile 25% (IQ1) | $86,875 | $74,933 |
| Interquartile 75% (IQ3) | $125,544 | $98,053 |
| Interquartile Range (IQR) | $38,669 | $23,120 |
| Standard Deviation (Sample) | $36,623 | $24,791 |
| Standard Deviation (Population) | $36,255 | $24,608 |
Similar Demographics by Householder Income Ages 25 - 44 years
Demographics Similar to Australians by Householder Income Ages 25 - 44 years
In terms of householder income ages 25 - 44 years, the demographic groups most similar to Australians are Immigrants from Bolivia ($108,128, a difference of 0.20%), Immigrants from Lithuania ($108,149, a difference of 0.22%), Immigrants from Malaysia ($107,650, a difference of 0.24%), Immigrants from Indonesia ($107,627, a difference of 0.26%), and Israeli ($107,579, a difference of 0.31%).
| Demographics | Rating | Rank | Householder Income Ages 25 - 44 years |
| Immigrants | Switzerland | 100.0 /100 | #35 | Exceptional $109,185 |
| Latvians | 100.0 /100 | #36 | Exceptional $108,926 |
| Immigrants | Russia | 100.0 /100 | #37 | Exceptional $108,751 |
| Soviet Union | 100.0 /100 | #38 | Exceptional $108,457 |
| Immigrants | France | 99.9 /100 | #39 | Exceptional $108,257 |
| Immigrants | Lithuania | 99.9 /100 | #40 | Exceptional $108,149 |
| Immigrants | Bolivia | 99.9 /100 | #41 | Exceptional $108,128 |
| Australians | 99.9 /100 | #42 | Exceptional $107,912 |
| Immigrants | Malaysia | 99.9 /100 | #43 | Exceptional $107,650 |
| Immigrants | Indonesia | 99.9 /100 | #44 | Exceptional $107,627 |
| Israelis | 99.9 /100 | #45 | Exceptional $107,579 |
| Immigrants | Belarus | 99.9 /100 | #46 | Exceptional $107,393 |
| Estonians | 99.9 /100 | #47 | Exceptional $107,269 |
| Bulgarians | 99.9 /100 | #48 | Exceptional $107,264 |
| Immigrants | Turkey | 99.9 /100 | #49 | Exceptional $107,258 |
Demographics Similar to French Canadians by Householder Income Ages 25 - 44 years
In terms of householder income ages 25 - 44 years, the demographic groups most similar to French Canadians are French ($93,665, a difference of 0.030%), Puget Sound Salish ($93,661, a difference of 0.040%), Uruguayan ($93,631, a difference of 0.070%), Guamanian/Chamorro ($93,569, a difference of 0.13%), and German ($93,531, a difference of 0.18%).
| Demographics | Rating | Rank | Householder Income Ages 25 - 44 years |
| Scottish | 50.8 /100 | #172 | Average $94,622 |
| Finns | 50.6 /100 | #173 | Average $94,610 |
| Colombians | 50.0 /100 | #174 | Average $94,565 |
| English | 48.1 /100 | #175 | Average $94,429 |
| Immigrants | Immigrants | 48.0 /100 | #176 | Average $94,423 |
| Belgians | 45.8 /100 | #177 | Average $94,262 |
| Immigrants | South America | 42.8 /100 | #178 | Average $94,042 |
| French Canadians | 38.2 /100 | #179 | Fair $93,694 |
| French | 37.8 /100 | #180 | Fair $93,665 |
| Puget Sound Salish | 37.7 /100 | #181 | Fair $93,661 |
| Uruguayans | 37.3 /100 | #182 | Fair $93,631 |
| Guamanians/Chamorros | 36.5 /100 | #183 | Fair $93,569 |
| Germans | 36.0 /100 | #184 | Fair $93,531 |
| Immigrants | Eritrea | 35.2 /100 | #185 | Fair $93,466 |
| Sierra Leoneans | 34.8 /100 | #186 | Fair $93,435 |