Australian vs British Householder Income Ages 25 - 44 years
COMPARE
Australian
British
Householder Income Ages 25 - 44 years
Householder Income Ages 25 - 44 years Comparison
Australians
British
$107,912
HOUSEHOLDER INCOME AGES 25 - 44 YEARS
99.9/ 100
METRIC RATING
42nd/ 347
METRIC RANK
$98,359
HOUSEHOLDER INCOME AGES 25 - 44 YEARS
89.1/ 100
METRIC RATING
126th/ 347
METRIC RANK
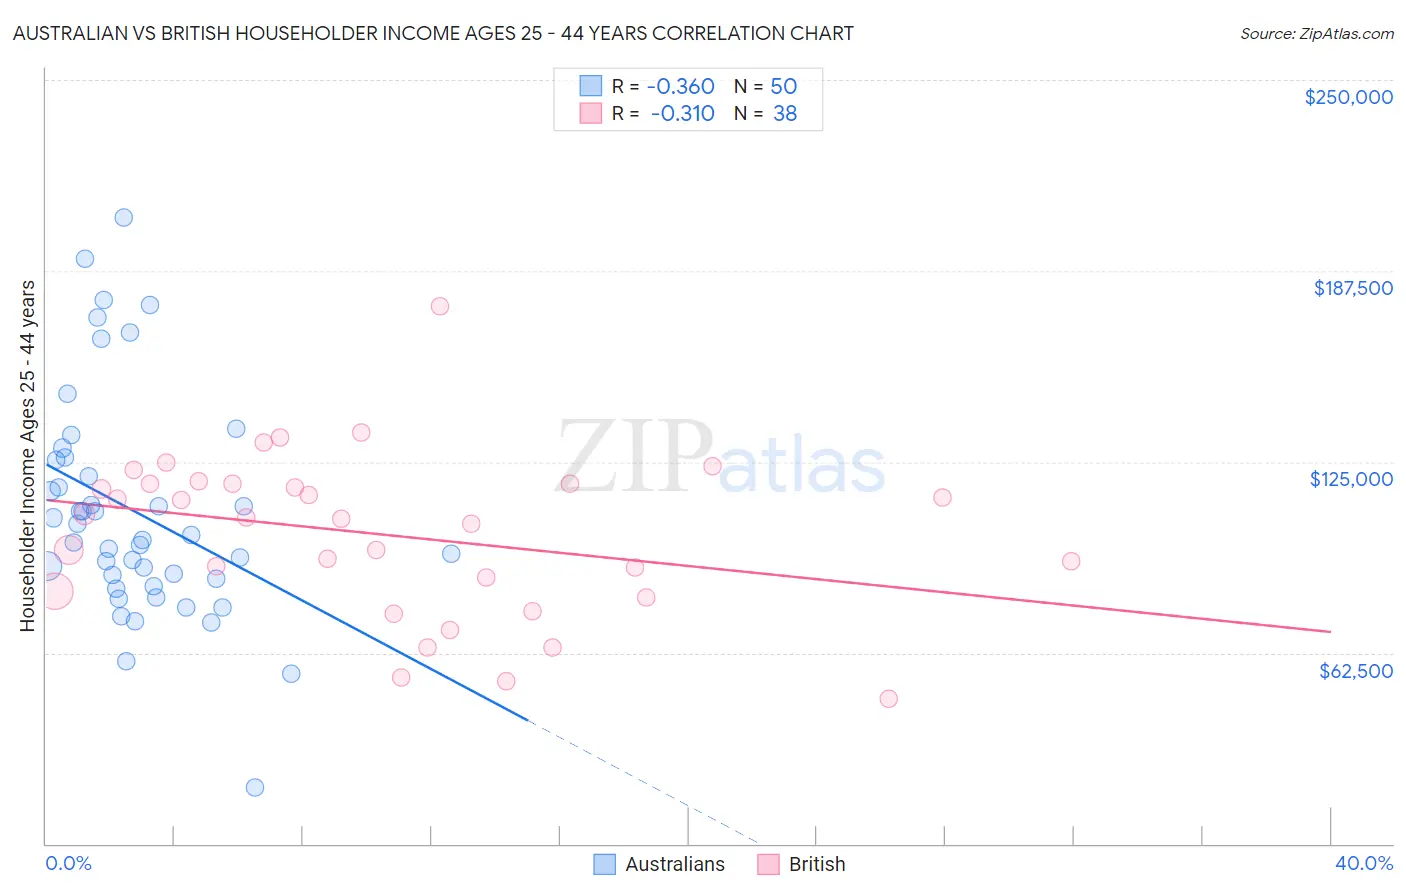
Australian vs British Householder Income Ages 25 - 44 years Correlation Chart
The statistical analysis conducted on geographies consisting of 223,617,547 people shows a mild negative correlation between the proportion of Australians and household income with householder between the ages 25 and 44 in the United States with a correlation coefficient (R) of -0.360 and weighted average of $107,912. Similarly, the statistical analysis conducted on geographies consisting of 528,162,005 people shows a mild negative correlation between the proportion of British and household income with householder between the ages 25 and 44 in the United States with a correlation coefficient (R) of -0.310 and weighted average of $98,359, a difference of 9.7%.
Householder Income Ages 25 - 44 years Correlation Summary
| Measurement | Australian | British |
| Minimum | $18,442 | $47,321 |
| Maximum | $205,156 | $175,781 |
| Range | $186,714 | $128,460 |
| Mean | $108,530 | $101,136 |
| Median | $100,349 | $106,554 |
| Interquartile 25% (IQ1) | $86,875 | $82,823 |
| Interquartile 75% (IQ3) | $125,544 | $117,796 |
| Interquartile Range (IQR) | $38,669 | $34,973 |
| Standard Deviation (Sample) | $36,623 | $26,587 |
| Standard Deviation (Population) | $36,255 | $26,235 |
Similar Demographics by Householder Income Ages 25 - 44 years
Demographics Similar to Australians by Householder Income Ages 25 - 44 years
In terms of householder income ages 25 - 44 years, the demographic groups most similar to Australians are Immigrants from Bolivia ($108,128, a difference of 0.20%), Immigrants from Lithuania ($108,149, a difference of 0.22%), Immigrants from Malaysia ($107,650, a difference of 0.24%), Immigrants from Indonesia ($107,627, a difference of 0.26%), and Israeli ($107,579, a difference of 0.31%).
| Demographics | Rating | Rank | Householder Income Ages 25 - 44 years |
| Immigrants | Switzerland | 100.0 /100 | #35 | Exceptional $109,185 |
| Latvians | 100.0 /100 | #36 | Exceptional $108,926 |
| Immigrants | Russia | 100.0 /100 | #37 | Exceptional $108,751 |
| Soviet Union | 100.0 /100 | #38 | Exceptional $108,457 |
| Immigrants | France | 99.9 /100 | #39 | Exceptional $108,257 |
| Immigrants | Lithuania | 99.9 /100 | #40 | Exceptional $108,149 |
| Immigrants | Bolivia | 99.9 /100 | #41 | Exceptional $108,128 |
| Australians | 99.9 /100 | #42 | Exceptional $107,912 |
| Immigrants | Malaysia | 99.9 /100 | #43 | Exceptional $107,650 |
| Immigrants | Indonesia | 99.9 /100 | #44 | Exceptional $107,627 |
| Israelis | 99.9 /100 | #45 | Exceptional $107,579 |
| Immigrants | Belarus | 99.9 /100 | #46 | Exceptional $107,393 |
| Estonians | 99.9 /100 | #47 | Exceptional $107,269 |
| Bulgarians | 99.9 /100 | #48 | Exceptional $107,264 |
| Immigrants | Turkey | 99.9 /100 | #49 | Exceptional $107,258 |
Demographics Similar to British by Householder Income Ages 25 - 44 years
In terms of householder income ages 25 - 44 years, the demographic groups most similar to British are Pakistani ($98,401, a difference of 0.040%), Serbian ($98,320, a difference of 0.040%), European ($98,310, a difference of 0.050%), Brazilian ($98,267, a difference of 0.090%), and Zimbabwean ($98,586, a difference of 0.23%).
| Demographics | Rating | Rank | Householder Income Ages 25 - 44 years |
| Jordanians | 92.8 /100 | #119 | Exceptional $99,186 |
| Swedes | 92.7 /100 | #120 | Exceptional $99,136 |
| Peruvians | 91.7 /100 | #121 | Exceptional $98,886 |
| Immigrants | Uzbekistan | 91.5 /100 | #122 | Exceptional $98,849 |
| Palestinians | 91.2 /100 | #123 | Exceptional $98,777 |
| Zimbabweans | 90.3 /100 | #124 | Exceptional $98,586 |
| Pakistanis | 89.3 /100 | #125 | Excellent $98,401 |
| British | 89.1 /100 | #126 | Excellent $98,359 |
| Serbians | 88.9 /100 | #127 | Excellent $98,320 |
| Europeans | 88.9 /100 | #128 | Excellent $98,310 |
| Brazilians | 88.6 /100 | #129 | Excellent $98,267 |
| Immigrants | Kuwait | 87.8 /100 | #130 | Excellent $98,122 |
| Immigrants | Albania | 86.6 /100 | #131 | Excellent $97,929 |
| Immigrants | Zimbabwe | 86.3 /100 | #132 | Excellent $97,880 |
| Tsimshian | 85.8 /100 | #133 | Excellent $97,809 |