Osage vs British Householder Income Ages 25 - 44 years
COMPARE
Osage
British
Householder Income Ages 25 - 44 years
Householder Income Ages 25 - 44 years Comparison
Osage
British
$84,461
HOUSEHOLDER INCOME AGES 25 - 44 YEARS
0.4/ 100
METRIC RATING
264th/ 347
METRIC RANK
$98,359
HOUSEHOLDER INCOME AGES 25 - 44 YEARS
89.1/ 100
METRIC RATING
126th/ 347
METRIC RANK
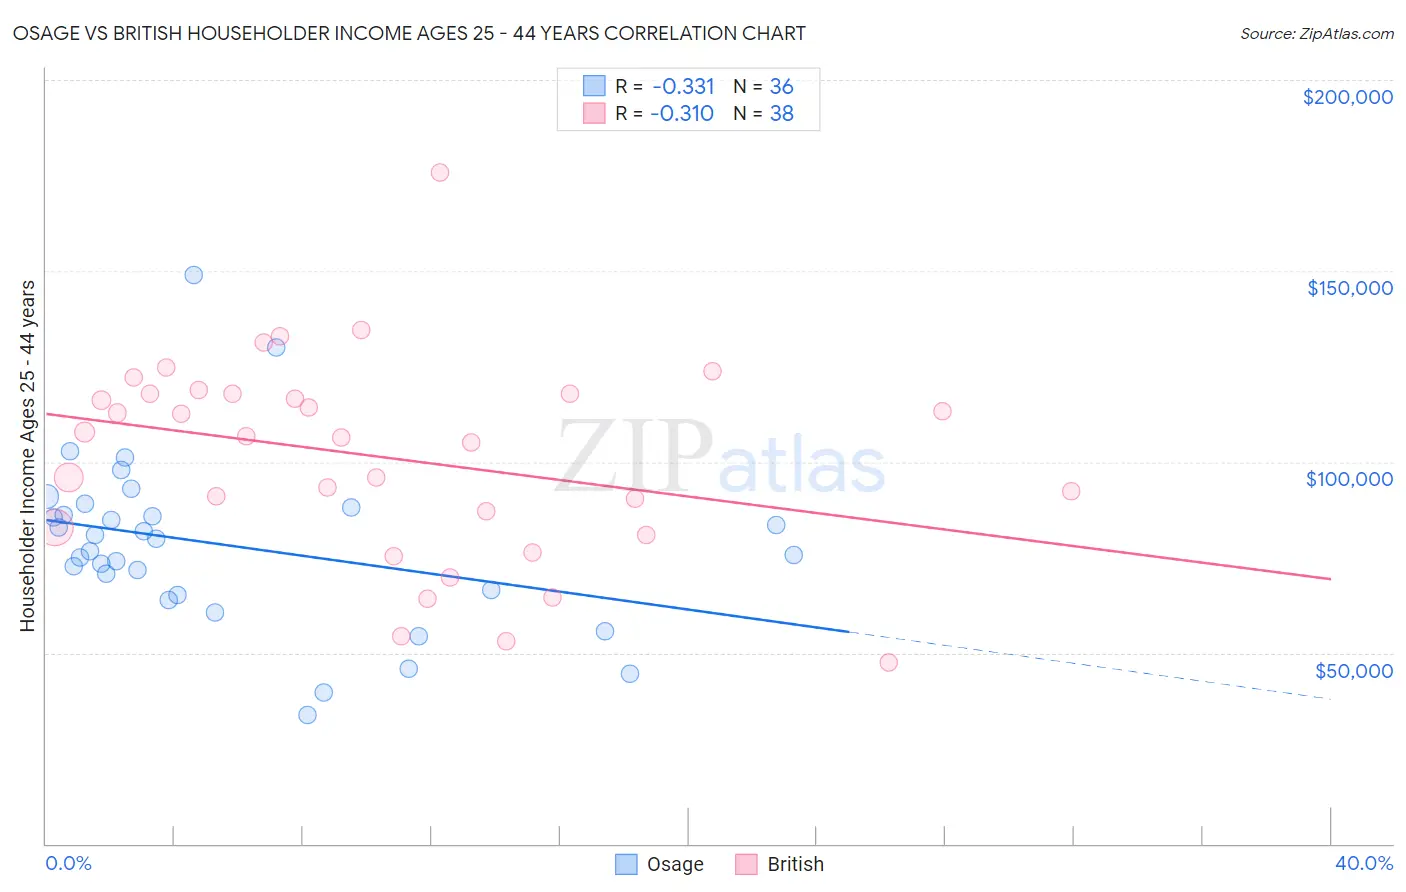
Osage vs British Householder Income Ages 25 - 44 years Correlation Chart
The statistical analysis conducted on geographies consisting of 91,715,382 people shows a mild negative correlation between the proportion of Osage and household income with householder between the ages 25 and 44 in the United States with a correlation coefficient (R) of -0.331 and weighted average of $84,461. Similarly, the statistical analysis conducted on geographies consisting of 528,162,005 people shows a mild negative correlation between the proportion of British and household income with householder between the ages 25 and 44 in the United States with a correlation coefficient (R) of -0.310 and weighted average of $98,359, a difference of 16.5%.
Householder Income Ages 25 - 44 years Correlation Summary
| Measurement | Osage | British |
| Minimum | $33,750 | $47,321 |
| Maximum | $148,966 | $175,781 |
| Range | $115,216 | $128,460 |
| Mean | $78,092 | $101,136 |
| Median | $78,270 | $106,554 |
| Interquartile 25% (IQ1) | $65,799 | $82,823 |
| Interquartile 75% (IQ3) | $87,100 | $117,796 |
| Interquartile Range (IQR) | $21,301 | $34,973 |
| Standard Deviation (Sample) | $22,591 | $26,587 |
| Standard Deviation (Population) | $22,275 | $26,235 |
Similar Demographics by Householder Income Ages 25 - 44 years
Demographics Similar to Osage by Householder Income Ages 25 - 44 years
In terms of householder income ages 25 - 44 years, the demographic groups most similar to Osage are Sudanese ($84,401, a difference of 0.070%), Belizean ($84,534, a difference of 0.090%), Cree ($84,574, a difference of 0.13%), Inupiat ($84,619, a difference of 0.19%), and Immigrants from Cabo Verde ($84,304, a difference of 0.19%).
| Demographics | Rating | Rank | Householder Income Ages 25 - 44 years |
| Mexican American Indians | 0.5 /100 | #257 | Tragic $85,066 |
| Immigrants | Nicaragua | 0.5 /100 | #258 | Tragic $84,914 |
| Immigrants | Senegal | 0.5 /100 | #259 | Tragic $84,848 |
| Americans | 0.4 /100 | #260 | Tragic $84,791 |
| Inupiat | 0.4 /100 | #261 | Tragic $84,619 |
| Cree | 0.4 /100 | #262 | Tragic $84,574 |
| Belizeans | 0.4 /100 | #263 | Tragic $84,534 |
| Osage | 0.4 /100 | #264 | Tragic $84,461 |
| Sudanese | 0.4 /100 | #265 | Tragic $84,401 |
| Immigrants | Cabo Verde | 0.3 /100 | #266 | Tragic $84,304 |
| Hmong | 0.3 /100 | #267 | Tragic $84,258 |
| Sub-Saharan Africans | 0.3 /100 | #268 | Tragic $84,235 |
| Spanish American Indians | 0.3 /100 | #269 | Tragic $84,085 |
| Jamaicans | 0.3 /100 | #270 | Tragic $83,933 |
| Somalis | 0.2 /100 | #271 | Tragic $83,752 |
Demographics Similar to British by Householder Income Ages 25 - 44 years
In terms of householder income ages 25 - 44 years, the demographic groups most similar to British are Pakistani ($98,401, a difference of 0.040%), Serbian ($98,320, a difference of 0.040%), European ($98,310, a difference of 0.050%), Brazilian ($98,267, a difference of 0.090%), and Zimbabwean ($98,586, a difference of 0.23%).
| Demographics | Rating | Rank | Householder Income Ages 25 - 44 years |
| Jordanians | 92.8 /100 | #119 | Exceptional $99,186 |
| Swedes | 92.7 /100 | #120 | Exceptional $99,136 |
| Peruvians | 91.7 /100 | #121 | Exceptional $98,886 |
| Immigrants | Uzbekistan | 91.5 /100 | #122 | Exceptional $98,849 |
| Palestinians | 91.2 /100 | #123 | Exceptional $98,777 |
| Zimbabweans | 90.3 /100 | #124 | Exceptional $98,586 |
| Pakistanis | 89.3 /100 | #125 | Excellent $98,401 |
| British | 89.1 /100 | #126 | Excellent $98,359 |
| Serbians | 88.9 /100 | #127 | Excellent $98,320 |
| Europeans | 88.9 /100 | #128 | Excellent $98,310 |
| Brazilians | 88.6 /100 | #129 | Excellent $98,267 |
| Immigrants | Kuwait | 87.8 /100 | #130 | Excellent $98,122 |
| Immigrants | Albania | 86.6 /100 | #131 | Excellent $97,929 |
| Immigrants | Zimbabwe | 86.3 /100 | #132 | Excellent $97,880 |
| Tsimshian | 85.8 /100 | #133 | Excellent $97,809 |