Portuguese vs British Householder Income Ages 25 - 44 years
COMPARE
Portuguese
British
Householder Income Ages 25 - 44 years
Householder Income Ages 25 - 44 years Comparison
Portuguese
British
$99,429
HOUSEHOLDER INCOME AGES 25 - 44 YEARS
93.7/ 100
METRIC RATING
116th/ 347
METRIC RANK
$98,359
HOUSEHOLDER INCOME AGES 25 - 44 YEARS
89.1/ 100
METRIC RATING
126th/ 347
METRIC RANK
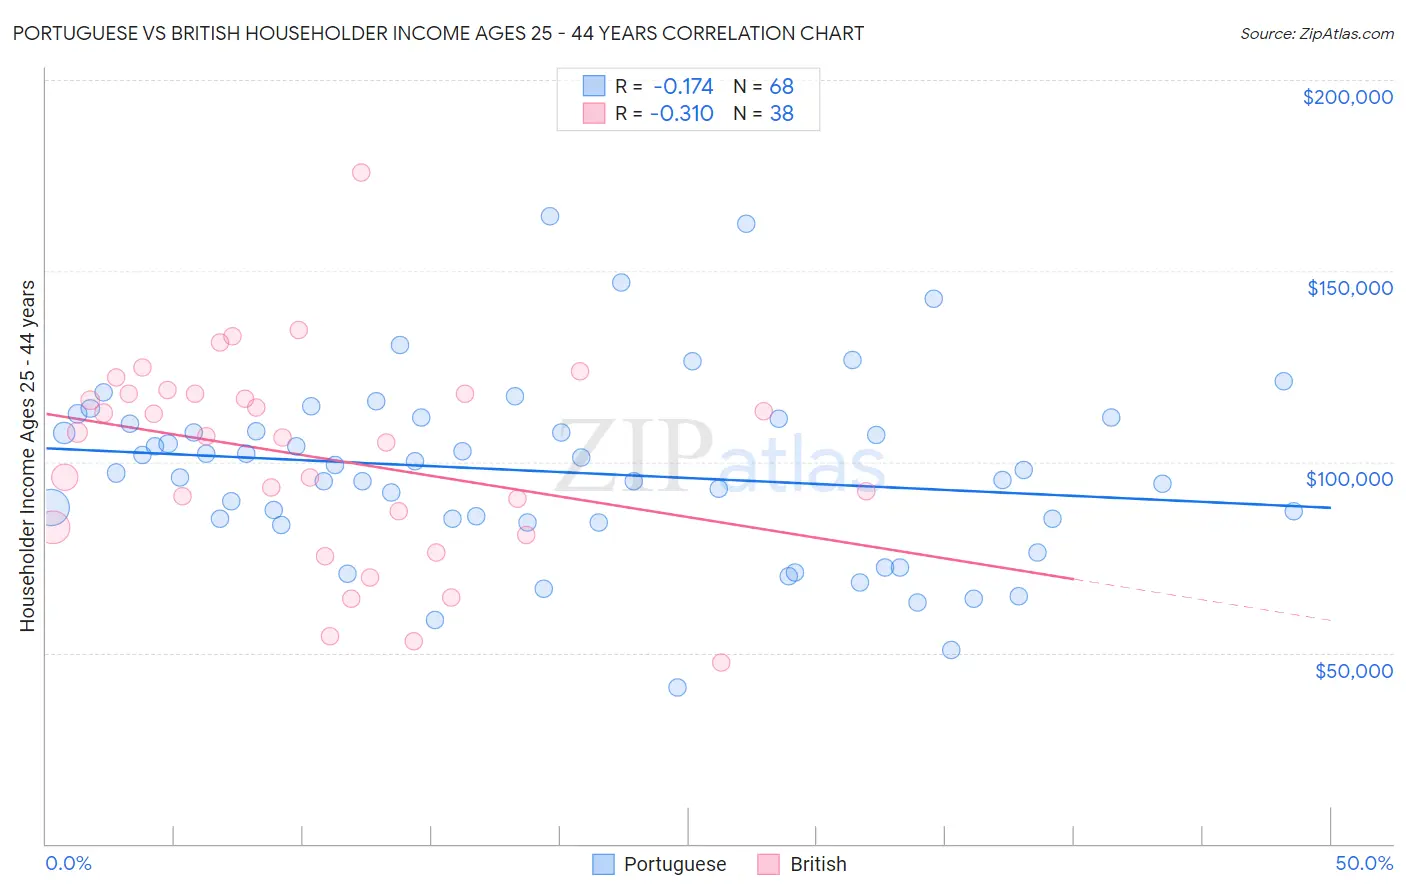
Portuguese vs British Householder Income Ages 25 - 44 years Correlation Chart
The statistical analysis conducted on geographies consisting of 448,408,954 people shows a poor negative correlation between the proportion of Portuguese and household income with householder between the ages 25 and 44 in the United States with a correlation coefficient (R) of -0.174 and weighted average of $99,429. Similarly, the statistical analysis conducted on geographies consisting of 528,162,005 people shows a mild negative correlation between the proportion of British and household income with householder between the ages 25 and 44 in the United States with a correlation coefficient (R) of -0.310 and weighted average of $98,359, a difference of 1.1%.
Householder Income Ages 25 - 44 years Correlation Summary
| Measurement | Portuguese | British |
| Minimum | $41,033 | $47,321 |
| Maximum | $164,238 | $175,781 |
| Range | $123,205 | $128,460 |
| Mean | $97,431 | $101,136 |
| Median | $97,526 | $106,554 |
| Interquartile 25% (IQ1) | $84,648 | $82,823 |
| Interquartile 75% (IQ3) | $110,670 | $117,796 |
| Interquartile Range (IQR) | $26,022 | $34,973 |
| Standard Deviation (Sample) | $23,647 | $26,587 |
| Standard Deviation (Population) | $23,472 | $26,235 |
Demographics Similar to Portuguese and British by Householder Income Ages 25 - 44 years
In terms of householder income ages 25 - 44 years, the demographic groups most similar to Portuguese are Carpatho Rusyn ($99,449, a difference of 0.020%), Immigrants from Western Asia ($99,516, a difference of 0.090%), Tongan ($99,604, a difference of 0.18%), Immigrants from Northern Africa ($99,232, a difference of 0.20%), and Syrian ($99,215, a difference of 0.22%). Similarly, the demographic groups most similar to British are Pakistani ($98,401, a difference of 0.040%), Serbian ($98,320, a difference of 0.040%), European ($98,310, a difference of 0.050%), Brazilian ($98,267, a difference of 0.090%), and Zimbabwean ($98,586, a difference of 0.23%).
| Demographics | Rating | Rank | Householder Income Ages 25 - 44 years |
| Chileans | 95.1 /100 | #111 | Exceptional $99,900 |
| Poles | 94.5 /100 | #112 | Exceptional $99,685 |
| Tongans | 94.2 /100 | #113 | Exceptional $99,604 |
| Immigrants | Western Asia | 94.0 /100 | #114 | Exceptional $99,516 |
| Carpatho Rusyns | 93.7 /100 | #115 | Exceptional $99,449 |
| Portuguese | 93.7 /100 | #116 | Exceptional $99,429 |
| Immigrants | Northern Africa | 93.0 /100 | #117 | Exceptional $99,232 |
| Syrians | 92.9 /100 | #118 | Exceptional $99,215 |
| Jordanians | 92.8 /100 | #119 | Exceptional $99,186 |
| Swedes | 92.7 /100 | #120 | Exceptional $99,136 |
| Peruvians | 91.7 /100 | #121 | Exceptional $98,886 |
| Immigrants | Uzbekistan | 91.5 /100 | #122 | Exceptional $98,849 |
| Palestinians | 91.2 /100 | #123 | Exceptional $98,777 |
| Zimbabweans | 90.3 /100 | #124 | Exceptional $98,586 |
| Pakistanis | 89.3 /100 | #125 | Excellent $98,401 |
| British | 89.1 /100 | #126 | Excellent $98,359 |
| Serbians | 88.9 /100 | #127 | Excellent $98,320 |
| Europeans | 88.9 /100 | #128 | Excellent $98,310 |
| Brazilians | 88.6 /100 | #129 | Excellent $98,267 |
| Immigrants | Kuwait | 87.8 /100 | #130 | Excellent $98,122 |
| Immigrants | Albania | 86.6 /100 | #131 | Excellent $97,929 |