Nepalese vs Belizean Median Household Income
COMPARE
Nepalese
Belizean
Median Household Income
Median Household Income Comparison
Nepalese
Belizeans
$82,410
MEDIAN HOUSEHOLD INCOME
15.1/ 100
METRIC RATING
213th/ 347
METRIC RANK
$77,028
MEDIAN HOUSEHOLD INCOME
0.6/ 100
METRIC RATING
256th/ 347
METRIC RANK
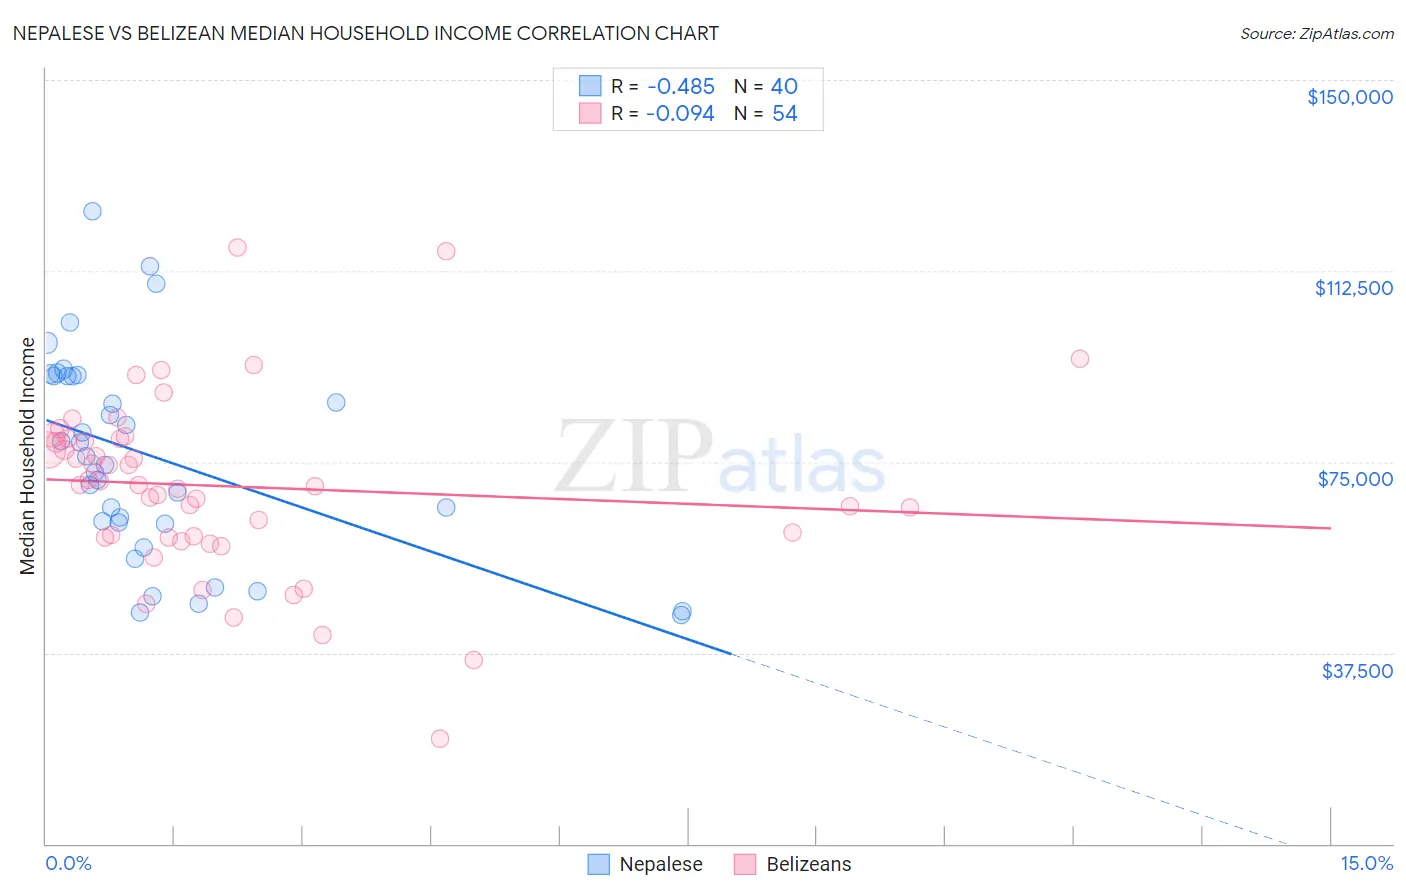
Nepalese vs Belizean Median Household Income Correlation Chart
The statistical analysis conducted on geographies consisting of 24,521,755 people shows a moderate negative correlation between the proportion of Nepalese and median household income in the United States with a correlation coefficient (R) of -0.485 and weighted average of $82,410. Similarly, the statistical analysis conducted on geographies consisting of 144,146,880 people shows a slight negative correlation between the proportion of Belizeans and median household income in the United States with a correlation coefficient (R) of -0.094 and weighted average of $77,028, a difference of 7.0%.
Median Household Income Correlation Summary
| Measurement | Nepalese | Belizean |
| Minimum | $45,000 | $20,723 |
| Maximum | $124,273 | $117,113 |
| Range | $79,273 | $96,390 |
| Mean | $75,935 | $70,224 |
| Median | $75,316 | $70,434 |
| Interquartile 25% (IQ1) | $63,001 | $60,138 |
| Interquartile 75% (IQ3) | $91,848 | $79,527 |
| Interquartile Range (IQR) | $28,847 | $19,389 |
| Standard Deviation (Sample) | $20,077 | $17,495 |
| Standard Deviation (Population) | $19,825 | $17,332 |
Similar Demographics by Median Household Income
Demographics Similar to Nepalese by Median Household Income
In terms of median household income, the demographic groups most similar to Nepalese are Venezuelan ($82,432, a difference of 0.030%), Salvadoran ($82,449, a difference of 0.050%), Panamanian ($82,272, a difference of 0.17%), Immigrants from Uruguay ($82,560, a difference of 0.18%), and Vietnamese ($82,248, a difference of 0.20%).
| Demographics | Rating | Rank | Median Household Income |
| Immigrants | Kenya | 21.3 /100 | #206 | Fair $83,068 |
| Dutch | 20.3 /100 | #207 | Fair $82,971 |
| French Canadians | 18.7 /100 | #208 | Poor $82,810 |
| Immigrants | Iraq | 16.7 /100 | #209 | Poor $82,594 |
| Immigrants | Uruguay | 16.4 /100 | #210 | Poor $82,560 |
| Salvadorans | 15.4 /100 | #211 | Poor $82,449 |
| Venezuelans | 15.3 /100 | #212 | Poor $82,432 |
| Nepalese | 15.1 /100 | #213 | Poor $82,410 |
| Panamanians | 14.0 /100 | #214 | Poor $82,272 |
| Vietnamese | 13.8 /100 | #215 | Poor $82,248 |
| Yugoslavians | 13.3 /100 | #216 | Poor $82,186 |
| Ecuadorians | 12.5 /100 | #217 | Poor $82,070 |
| Whites/Caucasians | 12.2 /100 | #218 | Poor $82,029 |
| Nigerians | 10.3 /100 | #219 | Poor $81,725 |
| Immigrants | Venezuela | 9.0 /100 | #220 | Tragic $81,506 |
Demographics Similar to Belizeans by Median Household Income
In terms of median household income, the demographic groups most similar to Belizeans are Immigrants from Senegal ($76,915, a difference of 0.15%), Immigrants from Nicaragua ($76,784, a difference of 0.32%), Spanish American Indian ($76,670, a difference of 0.47%), Jamaican ($76,583, a difference of 0.58%), and Immigrants from Grenada ($76,517, a difference of 0.67%).
| Demographics | Rating | Rank | Median Household Income |
| West Indians | 1.4 /100 | #249 | Tragic $78,455 |
| Immigrants | Laos | 1.3 /100 | #250 | Tragic $78,327 |
| Mexican American Indians | 1.2 /100 | #251 | Tragic $78,166 |
| Immigrants | West Indies | 1.0 /100 | #252 | Tragic $77,956 |
| Immigrants | St. Vincent and the Grenadines | 0.9 /100 | #253 | Tragic $77,690 |
| Sub-Saharan Africans | 0.8 /100 | #254 | Tragic $77,631 |
| Immigrants | Middle Africa | 0.8 /100 | #255 | Tragic $77,559 |
| Belizeans | 0.6 /100 | #256 | Tragic $77,028 |
| Immigrants | Senegal | 0.5 /100 | #257 | Tragic $76,915 |
| Immigrants | Nicaragua | 0.5 /100 | #258 | Tragic $76,784 |
| Spanish American Indians | 0.4 /100 | #259 | Tragic $76,670 |
| Jamaicans | 0.4 /100 | #260 | Tragic $76,583 |
| Immigrants | Grenada | 0.4 /100 | #261 | Tragic $76,517 |
| French American Indians | 0.4 /100 | #262 | Tragic $76,387 |
| Alaskan Athabascans | 0.4 /100 | #263 | Tragic $76,383 |