Assyrian/Chaldean/Syriac vs Marshallese Unemployment Among Seniors over 65 years
COMPARE
Assyrian/Chaldean/Syriac
Marshallese
Unemployment Among Seniors over 65 years
Unemployment Among Seniors over 65 years Comparison
Assyrians/Chaldeans/Syriacs
Marshallese
5.0%
UNEMPLOYMENT AMONG SENIORS OVER 65 YEARS
96.8/ 100
METRIC RATING
95th/ 347
METRIC RANK
5.3%
UNEMPLOYMENT AMONG SENIORS OVER 65 YEARS
3.1/ 100
METRIC RATING
233rd/ 347
METRIC RANK
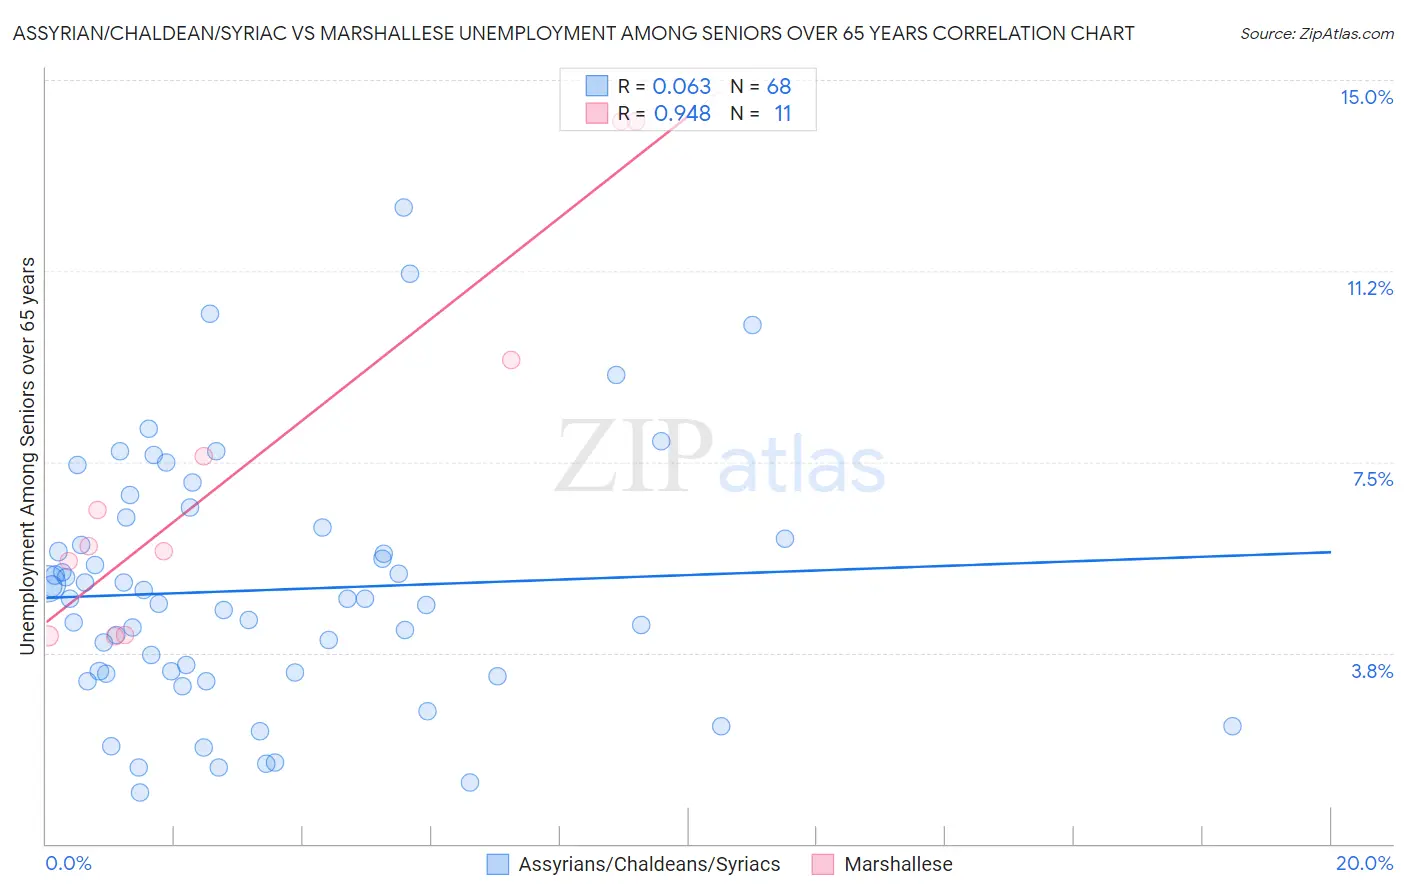
Assyrian/Chaldean/Syriac vs Marshallese Unemployment Among Seniors over 65 years Correlation Chart
The statistical analysis conducted on geographies consisting of 107,075,220 people shows a slight positive correlation between the proportion of Assyrians/Chaldeans/Syriacs and unemployment rate amomg seniors over the age of 65 in the United States with a correlation coefficient (R) of 0.063 and weighted average of 5.0%. Similarly, the statistical analysis conducted on geographies consisting of 14,371,080 people shows a near-perfect positive correlation between the proportion of Marshallese and unemployment rate amomg seniors over the age of 65 in the United States with a correlation coefficient (R) of 0.948 and weighted average of 5.3%, a difference of 5.6%.
Unemployment Among Seniors over 65 years Correlation Summary
| Measurement | Assyrian/Chaldean/Syriac | Marshallese |
| Minimum | 1.0% | 4.1% |
| Maximum | 12.5% | 14.2% |
| Range | 11.5% | 10.1% |
| Mean | 5.0% | 7.4% |
| Median | 4.8% | 5.9% |
| Interquartile 25% (IQ1) | 3.4% | 4.1% |
| Interquartile 75% (IQ3) | 6.1% | 9.5% |
| Interquartile Range (IQR) | 2.7% | 5.4% |
| Standard Deviation (Sample) | 2.4% | 3.7% |
| Standard Deviation (Population) | 2.4% | 3.6% |
Similar Demographics by Unemployment Among Seniors over 65 years
Demographics Similar to Assyrians/Chaldeans/Syriacs by Unemployment Among Seniors over 65 years
In terms of unemployment among seniors over 65 years, the demographic groups most similar to Assyrians/Chaldeans/Syriacs are Immigrants from Singapore (5.0%, a difference of 0.0%), Burmese (5.0%, a difference of 0.010%), Immigrants from Oceania (5.0%, a difference of 0.010%), Czechoslovakian (5.0%, a difference of 0.010%), and South African (5.0%, a difference of 0.070%).
| Demographics | Rating | Rank | Unemployment Among Seniors over 65 years |
| Afghans | 97.6 /100 | #88 | Exceptional 5.0% |
| Immigrants | South Central Asia | 97.6 /100 | #89 | Exceptional 5.0% |
| Immigrants | South Africa | 97.6 /100 | #90 | Exceptional 5.0% |
| Immigrants | Bolivia | 97.3 /100 | #91 | Exceptional 5.0% |
| Immigrants | Bulgaria | 97.3 /100 | #92 | Exceptional 5.0% |
| Austrians | 97.3 /100 | #93 | Exceptional 5.0% |
| Burmese | 96.8 /100 | #94 | Exceptional 5.0% |
| Assyrians/Chaldeans/Syriacs | 96.8 /100 | #95 | Exceptional 5.0% |
| Immigrants | Singapore | 96.8 /100 | #96 | Exceptional 5.0% |
| Immigrants | Oceania | 96.8 /100 | #97 | Exceptional 5.0% |
| Czechoslovakians | 96.7 /100 | #98 | Exceptional 5.0% |
| South Africans | 96.5 /100 | #99 | Exceptional 5.0% |
| Romanians | 95.5 /100 | #100 | Exceptional 5.0% |
| Yugoslavians | 95.4 /100 | #101 | Exceptional 5.0% |
| Immigrants | Thailand | 95.4 /100 | #102 | Exceptional 5.0% |
Demographics Similar to Marshallese by Unemployment Among Seniors over 65 years
In terms of unemployment among seniors over 65 years, the demographic groups most similar to Marshallese are Blackfeet (5.3%, a difference of 0.0%), Hopi (5.3%, a difference of 0.090%), Immigrants from Albania (5.3%, a difference of 0.10%), Hungarian (5.3%, a difference of 0.17%), and Immigrants from Argentina (5.3%, a difference of 0.20%).
| Demographics | Rating | Rank | Unemployment Among Seniors over 65 years |
| Immigrants | Croatia | 5.3 /100 | #226 | Tragic 5.3% |
| French American Indians | 5.2 /100 | #227 | Tragic 5.3% |
| Haitians | 4.4 /100 | #228 | Tragic 5.3% |
| Samoans | 4.2 /100 | #229 | Tragic 5.3% |
| Immigrants | Argentina | 4.0 /100 | #230 | Tragic 5.3% |
| Hungarians | 3.9 /100 | #231 | Tragic 5.3% |
| Hopi | 3.5 /100 | #232 | Tragic 5.3% |
| Marshallese | 3.1 /100 | #233 | Tragic 5.3% |
| Blackfeet | 3.1 /100 | #234 | Tragic 5.3% |
| Immigrants | Albania | 2.7 /100 | #235 | Tragic 5.3% |
| Immigrants | Costa Rica | 2.1 /100 | #236 | Tragic 5.3% |
| Immigrants | Greece | 2.0 /100 | #237 | Tragic 5.3% |
| Immigrants | Israel | 2.0 /100 | #238 | Tragic 5.3% |
| Immigrants | Senegal | 1.8 /100 | #239 | Tragic 5.3% |
| Immigrants | Trinidad and Tobago | 1.6 /100 | #240 | Tragic 5.3% |