Immigrants from Kuwait vs Immigrants from Bolivia Median Female Earnings

COMPARE

Immigrants from Kuwait
Race
Ancestry
AfghanAfricanAlaska NativeAlaskan AthabascanAlbanianAleutAlsatianAmericanApacheArabArapahoArgentineanArmenianAssyrian/Chaldean/SyriacAustralianAustrianBahamianBangladeshiBarbadianBasqueBelgianBelizeanBermudanBhutaneseBlackfeetBolivianBrazilianBritishBritish West IndianBulgarianBurmeseCajunCambodianCanadianCape VerdeanCarpatho RusynCelticCentral AmericanCentral American IndianCherokeeCheyenneChickasawChileanChineseChippewaChoctawColombianColvilleComancheCosta RicanCreeCreekCroatianCrowCubanCypriotCzechCzechoslovakianDanishDelawareDominicanDutchDutch West IndianEastern EuropeanEcuadorianEgyptianEnglishEstonianEthiopianEuropeanFijianFilipinoFinnishFrenchFrench American IndianFrench CanadianGermanGerman RussianGhanaianGreekGuamanian/ChamorroGuatemalanGuyaneseHaitianHmongHonduranHopiHoumaHungarianIcelanderIndian (Asian)IndonesianInupiatIranianIraqiIrishIroquoisIsraeliItalianJamaicanJapaneseJordanianKenyanKiowaKoreanLaotianLatvianLebaneseLiberianLithuanianLumbeeLuxembourgerMacedonianMalaysianMalteseMarshalleseMenomineeMexicanMexican American IndianMongolianMoroccanNative HawaiianNavajoNepaleseNew ZealanderNicaraguanNigerianNorthern EuropeanNorwegianOkinawanOsageOttawaPaiutePakistaniPalestinianPanamanianParaguayanPennsylvania GermanPeruvianPimaPolishPortuguesePotawatomiPuebloPuerto RicanPuget Sound SalishRomanianRussianSalvadoranSamoanScandinavianScotch-IrishScottishSeminoleSenegaleseSerbianShoshoneSierra LeoneanSiouxSlavicSlovakSloveneSomaliSouth AfricanSouth AmericanSouth American IndianSoviet UnionSpaniardSpanishSpanish AmericanSpanish American IndianSri LankanSubsaharan AfricanSudaneseSwedishSwissSyrianTaiwaneseThaiTlingit-HaidaTohono O'OdhamTonganTrinidadian and TobagonianTsimshianTurkishU.S. Virgin IslanderUgandanUkrainianUruguayanUteVenezuelanVietnameseWelshWest IndianYakamaYaquiYugoslavianYumanYup'ikZimbabwean
Immigration
NonimmigrantsImmigrantsAfghanistanAfricaAlbaniaArgentinaArmeniaAsiaAustraliaAustriaBahamasBangladeshBarbadosBelarusBelgiumBelizeBosnia and HerzegovinaBrazilBulgariaBurma/MyanmarCabo VerdeCambodiaCameroonCanadaCaribbeanCentral AmericaChileChinaColombiaCongoCosta RicaCroatiaCubaCzechoslovakiaDenmarkDominicaDominican RepublicEastern AfricaEastern AsiaEastern EuropeEcuadorEgyptEl SalvadorEnglandEritreaEthiopiaEuropeFijiFranceGermanyGhanaGreeceGrenadaGuatemalaGuyanaHaitiHondurasHong KongHungaryIndiaIndonesiaIranIraqIrelandIsraelItalyJamaicaJapanJordanKazakhstanKenyaKoreaKuwaitLaosLatin AmericaLatviaLebanonLiberiaLithuaniaMalaysiaMexicoMicronesiaMiddle AfricaMoldovaMoroccoNepalNetherlandsNicaraguaNigeriaNorth AmericaNorth MacedoniaNorthern AfricaNorthern EuropeNorwayOceaniaPakistanPanamaPeruPhilippinesPolandPortugalRomaniaRussiaSaudi ArabiaScotlandSenegalSerbiaSierra LeoneSingaporeSomaliaSouth AfricaSouth AmericaSouth Central AsiaSouth Eastern AsiaSouthern EuropeSpainSri LankaSt. Vincent and the GrenadinesSudanSwedenSwitzerlandSyriaTaiwanThailandTrinidad and TobagoTurkeyUgandaUkraineUruguayUzbekistanVenezuelaVietnamWest IndiesWestern AfricaWestern AsiaWestern EuropeYemenZaireZimbabweAzores
Immigrants from Bolivia
Race
Ancestry
AfghanAfricanAlaska NativeAlaskan AthabascanAlbanianAleutAlsatianAmericanApacheArabArapahoArgentineanArmenianAssyrian/Chaldean/SyriacAustralianAustrianBahamianBangladeshiBarbadianBasqueBelgianBelizeanBermudanBhutaneseBlackfeetBolivianBrazilianBritishBritish West IndianBulgarianBurmeseCajunCambodianCanadianCape VerdeanCarpatho RusynCelticCentral AmericanCentral American IndianCherokeeCheyenneChickasawChileanChineseChippewaChoctawColombianColvilleComancheCosta RicanCreeCreekCroatianCrowCubanCypriotCzechCzechoslovakianDanishDelawareDominicanDutchDutch West IndianEastern EuropeanEcuadorianEgyptianEnglishEstonianEthiopianEuropeanFijianFilipinoFinnishFrenchFrench American IndianFrench CanadianGermanGerman RussianGhanaianGreekGuamanian/ChamorroGuatemalanGuyaneseHaitianHmongHonduranHopiHoumaHungarianIcelanderIndian (Asian)IndonesianInupiatIranianIraqiIrishIroquoisIsraeliItalianJamaicanJapaneseJordanianKenyanKiowaKoreanLaotianLatvianLebaneseLiberianLithuanianLumbeeLuxembourgerMacedonianMalaysianMalteseMarshalleseMenomineeMexicanMexican American IndianMongolianMoroccanNative HawaiianNavajoNepaleseNew ZealanderNicaraguanNigerianNorthern EuropeanNorwegianOkinawanOsageOttawaPaiutePakistaniPalestinianPanamanianParaguayanPennsylvania GermanPeruvianPimaPolishPortuguesePotawatomiPuebloPuerto RicanPuget Sound SalishRomanianRussianSalvadoranSamoanScandinavianScotch-IrishScottishSeminoleSenegaleseSerbianShoshoneSierra LeoneanSiouxSlavicSlovakSloveneSomaliSouth AfricanSouth AmericanSouth American IndianSoviet UnionSpaniardSpanishSpanish AmericanSpanish American IndianSri LankanSubsaharan AfricanSudaneseSwedishSwissSyrianTaiwaneseThaiTlingit-HaidaTohono O'OdhamTonganTrinidadian and TobagonianTsimshianTurkishU.S. Virgin IslanderUgandanUkrainianUruguayanUteVenezuelanVietnameseWelshWest IndianYakamaYaquiYugoslavianYumanYup'ikZimbabwean
Immigration
NonimmigrantsImmigrantsAfghanistanAfricaAlbaniaArgentinaArmeniaAsiaAustraliaAustriaBahamasBangladeshBarbadosBelarusBelgiumBelizeBoliviaBosnia and HerzegovinaBrazilBulgariaBurma/MyanmarCabo VerdeCambodiaCameroonCanadaCaribbeanCentral AmericaChileChinaColombiaCongoCosta RicaCroatiaCubaCzechoslovakiaDenmarkDominicaDominican RepublicEastern AfricaEastern AsiaEastern EuropeEcuadorEgyptEl SalvadorEnglandEritreaEthiopiaEuropeFijiFranceGermanyGhanaGreeceGrenadaGuatemalaGuyanaHaitiHondurasHong KongHungaryIndiaIndonesiaIranIraqIrelandIsraelItalyJamaicaJapanJordanKazakhstanKenyaKoreaLaosLatin AmericaLatviaLebanonLiberiaLithuaniaMalaysiaMexicoMicronesiaMiddle AfricaMoldovaMoroccoNepalNetherlandsNicaraguaNigeriaNorth AmericaNorth MacedoniaNorthern AfricaNorthern EuropeNorwayOceaniaPakistanPanamaPeruPhilippinesPolandPortugalRomaniaRussiaSaudi ArabiaScotlandSenegalSerbiaSierra LeoneSingaporeSomaliaSouth AfricaSouth AmericaSouth Central AsiaSouth Eastern AsiaSouthern EuropeSpainSri LankaSt. Vincent and the GrenadinesSudanSwedenSwitzerlandSyriaTaiwanThailandTrinidad and TobagoTurkeyUgandaUkraineUruguayUzbekistanVenezuelaVietnamWest IndiesWestern AfricaWestern AsiaWestern EuropeYemenZaireZimbabweAzores
Median Female Earnings
Income
Poverty
Unemployment
Labor Participation
Family Structure
Vehicle Availability
Education Level
Disability

Median Female Earnings Comparison

Immigrants from Kuwait

Immigrants from Bolivia

Exceptional
Exceptional
$41,055
MEDIAN FEMALE EARNINGS
94.4/ 100
METRIC RATING
120th/ 347
METRIC RANK
$43,467
MEDIAN FEMALE EARNINGS
100.0/ 100
METRIC RATING
46th/ 347
METRIC RANK

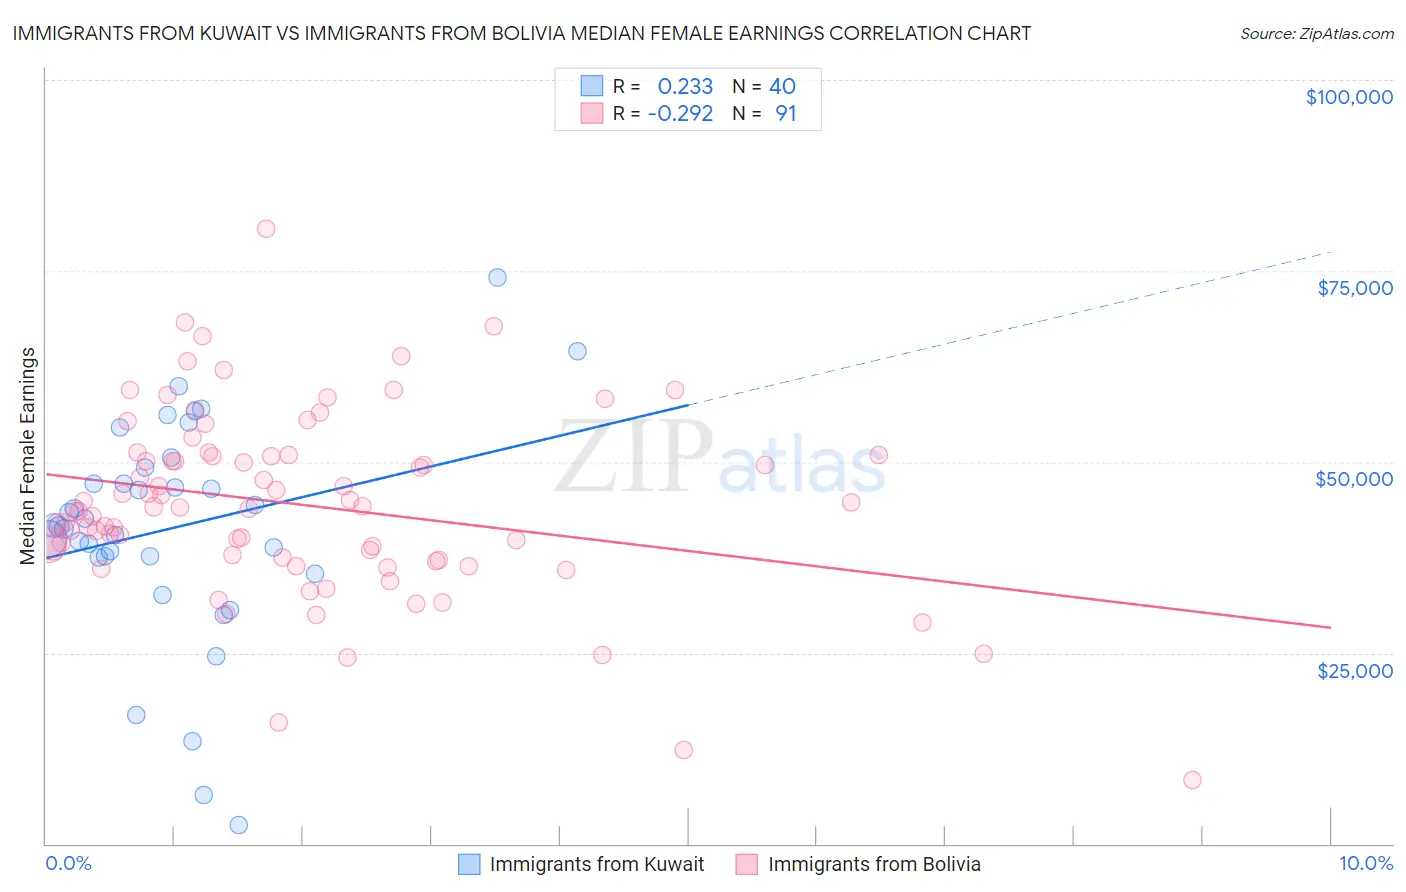
Immigrants from Kuwait vs Immigrants from Bolivia Median Female Earnings Correlation Chart

The statistical analysis conducted on geographies consisting of 136,915,503 people shows a weak positive correlation between the proportion of Immigrants from Kuwait and median female earnings in the United States with a correlation coefficient (R) of 0.233 and weighted average of $41,055. Similarly, the statistical analysis conducted on geographies consisting of 158,712,262 people shows a weak negative correlation between the proportion of Immigrants from Bolivia and median female earnings in the United States with a correlation coefficient (R) of -0.292 and weighted average of $43,467, a difference of 5.9%.
Immigrants from Kuwait vs Immigrants from Bolivia Median Female Earnings

Median Female Earnings Correlation Summary

MeasurementImmigrants from KuwaitImmigrants from Bolivia
Minimum$2,499$8,362
Maximum$74,079$80,500
Range$71,580$72,138
Mean$41,287$44,359
Median$41,597$43,989
Interquartile 25% (IQ1)$37,555$37,479
Interquartile 75% (IQ3)$48,255$50,958
Interquartile Range (IQR)$10,700$13,479
Standard Deviation (Sample)$14,451$12,073
Standard Deviation (Population)$14,269$12,007

Similar Demographics by Median Female Earnings

Demographics Similar to Immigrants from Kuwait by Median Female Earnings

In terms of median female earnings, the demographic groups most similar to Immigrants from Kuwait are Immigrants from Philippines ($41,114, a difference of 0.15%), Croatian ($40,993, a difference of 0.15%), Immigrants from Jordan ($40,977, a difference of 0.19%), Guyanese ($40,973, a difference of 0.20%), and Trinidadian and Tobagonian ($40,958, a difference of 0.24%).
DemographicsRating | RankMedian Female Earnings
Macedonians
96.4
/100
|
#113
Exceptional
$41,286
Immigrants | England
96.4
/100
|
#114
Exceptional
$41,277
Koreans
96.4
/100
|
#115
Exceptional
$41,276
Immigrants | Brazil
96.4
/100
|
#116
Exceptional
$41,273
Barbadians
96.3
/100
|
#117
Exceptional
$41,261
Immigrants | Lebanon
95.6
/100
|
#118
Exceptional
$41,183
Immigrants | Philippines
95.0
/100
|
#119
Exceptional
$41,114
Immigrants | Kuwait
94.4
/100
|
#120
Exceptional
$41,055
Croatians
93.7
/100
|
#121
Exceptional
$40,993
Immigrants | Jordan
93.5
/100
|
#122
Exceptional
$40,977
Guyanese
93.4
/100
|
#123
Exceptional
$40,973
Trinidadians and Tobagonians
93.2
/100
|
#124
Exceptional
$40,958
Austrians
92.7
/100
|
#125
Exceptional
$40,923
Immigrants | Trinidad and Tobago
92.3
/100
|
#126
Exceptional
$40,895
Ugandans
92.2
/100
|
#127
Exceptional
$40,889

Demographics Similar to Immigrants from Bolivia by Median Female Earnings

In terms of median female earnings, the demographic groups most similar to Immigrants from Bolivia are Bolivian ($43,445, a difference of 0.050%), Immigrants from Europe ($43,523, a difference of 0.13%), Immigrants from Indonesia ($43,412, a difference of 0.13%), Immigrants from Serbia ($43,385, a difference of 0.19%), and Immigrants from Czechoslovakia ($43,571, a difference of 0.24%).
DemographicsRating | RankMedian Female Earnings
Israelis
100.0
/100
|
#39
Exceptional
$43,852
Immigrants | Malaysia
100.0
/100
|
#40
Exceptional
$43,835
Bhutanese
100.0
/100
|
#41
Exceptional
$43,648
Immigrants | Denmark
100.0
/100
|
#42
Exceptional
$43,646
Bulgarians
100.0
/100
|
#43
Exceptional
$43,638
Immigrants | Czechoslovakia
100.0
/100
|
#44
Exceptional
$43,571
Immigrants | Europe
100.0
/100
|
#45
Exceptional
$43,523
Immigrants | Bolivia
100.0
/100
|
#46
Exceptional
$43,467
Bolivians
100.0
/100
|
#47
Exceptional
$43,445
Immigrants | Indonesia
100.0
/100
|
#48
Exceptional
$43,412
Immigrants | Serbia
100.0
/100
|
#49
Exceptional
$43,385
Immigrants | Uzbekistan
100.0
/100
|
#50
Exceptional
$43,363
Maltese
100.0
/100
|
#51
Exceptional
$43,357
Immigrants | Lithuania
99.9
/100
|
#52
Exceptional
$43,317
Immigrants | Eastern Europe
99.9
/100
|
#53
Exceptional
$43,309