Afghan vs Immigrants from Bolivia Median Female Earnings
COMPARE
Afghan
Immigrants from Bolivia
Median Female Earnings
Median Female Earnings Comparison
Afghans
Immigrants from Bolivia
$43,077
MEDIAN FEMALE EARNINGS
99.9/ 100
METRIC RATING
62nd/ 347
METRIC RANK
$43,467
MEDIAN FEMALE EARNINGS
100.0/ 100
METRIC RATING
46th/ 347
METRIC RANK
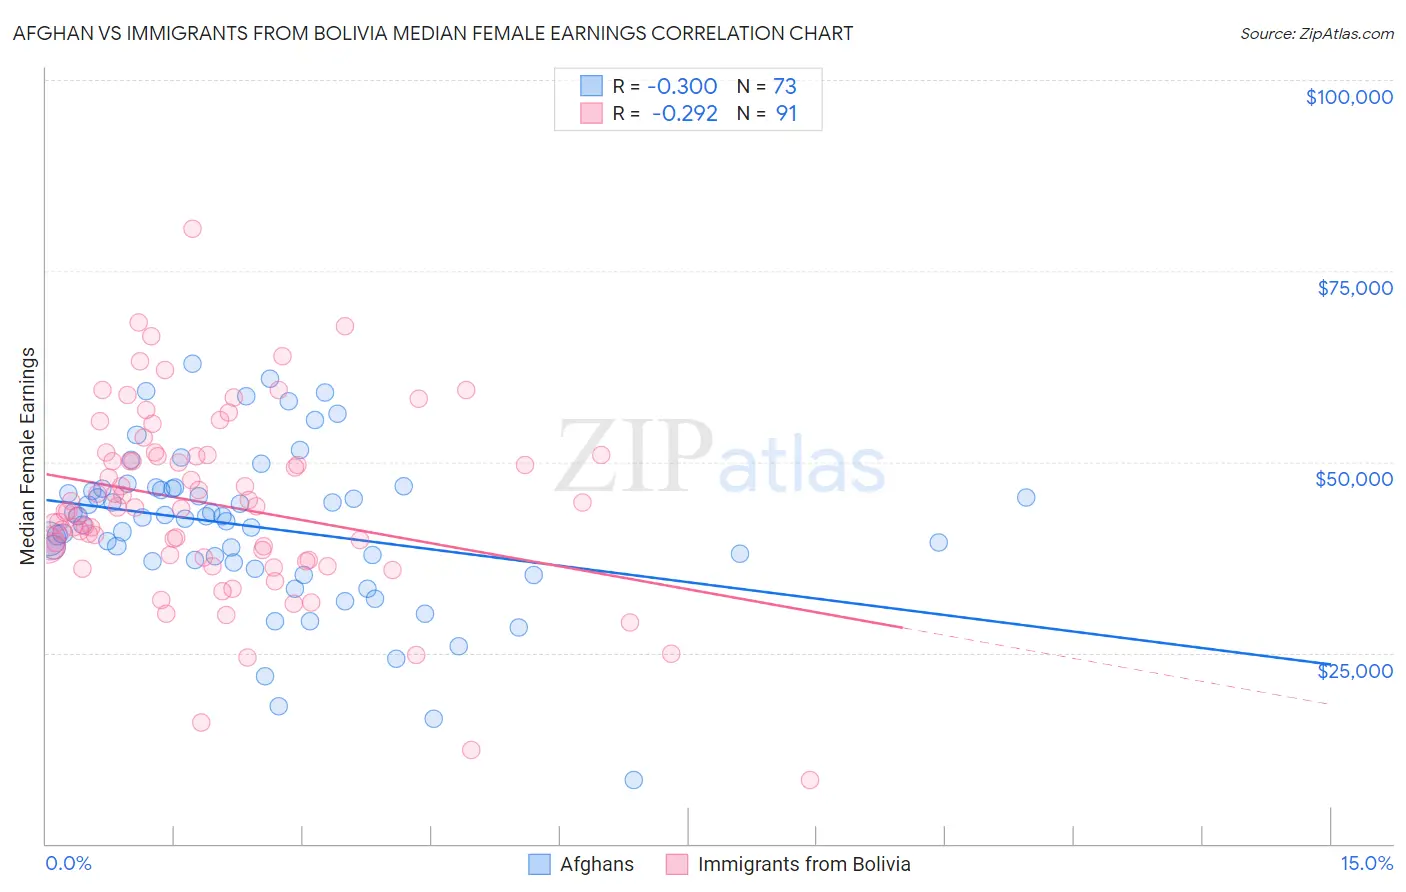
Afghan vs Immigrants from Bolivia Median Female Earnings Correlation Chart
The statistical analysis conducted on geographies consisting of 148,870,057 people shows a mild negative correlation between the proportion of Afghans and median female earnings in the United States with a correlation coefficient (R) of -0.300 and weighted average of $43,077. Similarly, the statistical analysis conducted on geographies consisting of 158,712,262 people shows a weak negative correlation between the proportion of Immigrants from Bolivia and median female earnings in the United States with a correlation coefficient (R) of -0.292 and weighted average of $43,467, a difference of 0.91%.
Median Female Earnings Correlation Summary
| Measurement | Afghan | Immigrants from Bolivia |
| Minimum | $8,380 | $8,362 |
| Maximum | $62,780 | $80,500 |
| Range | $54,400 | $72,138 |
| Mean | $41,426 | $44,359 |
| Median | $42,748 | $43,989 |
| Interquartile 25% (IQ1) | $36,907 | $37,479 |
| Interquartile 75% (IQ3) | $46,506 | $50,958 |
| Interquartile Range (IQR) | $9,599 | $13,479 |
| Standard Deviation (Sample) | $10,289 | $12,073 |
| Standard Deviation (Population) | $10,218 | $12,007 |
Demographics Similar to Afghans and Immigrants from Bolivia by Median Female Earnings
In terms of median female earnings, the demographic groups most similar to Afghans are Immigrants from Bulgaria ($43,085, a difference of 0.020%), Immigrants from Ukraine ($43,069, a difference of 0.020%), Immigrants from Latvia ($43,099, a difference of 0.050%), Immigrants from Pakistan ($43,052, a difference of 0.060%), and Estonian ($43,106, a difference of 0.070%). Similarly, the demographic groups most similar to Immigrants from Bolivia are Bolivian ($43,445, a difference of 0.050%), Immigrants from Europe ($43,523, a difference of 0.13%), Immigrants from Indonesia ($43,412, a difference of 0.13%), Immigrants from Serbia ($43,385, a difference of 0.19%), and Immigrants from Czechoslovakia ($43,571, a difference of 0.24%).
| Demographics | Rating | Rank | Median Female Earnings |
| Immigrants | Czechoslovakia | 100.0 /100 | #44 | Exceptional $43,571 |
| Immigrants | Europe | 100.0 /100 | #45 | Exceptional $43,523 |
| Immigrants | Bolivia | 100.0 /100 | #46 | Exceptional $43,467 |
| Bolivians | 100.0 /100 | #47 | Exceptional $43,445 |
| Immigrants | Indonesia | 100.0 /100 | #48 | Exceptional $43,412 |
| Immigrants | Serbia | 100.0 /100 | #49 | Exceptional $43,385 |
| Immigrants | Uzbekistan | 100.0 /100 | #50 | Exceptional $43,363 |
| Maltese | 100.0 /100 | #51 | Exceptional $43,357 |
| Immigrants | Lithuania | 99.9 /100 | #52 | Exceptional $43,317 |
| Immigrants | Eastern Europe | 99.9 /100 | #53 | Exceptional $43,309 |
| Australians | 99.9 /100 | #54 | Exceptional $43,308 |
| Egyptians | 99.9 /100 | #55 | Exceptional $43,305 |
| Immigrants | Croatia | 99.9 /100 | #56 | Exceptional $43,258 |
| Ethiopians | 99.9 /100 | #57 | Exceptional $43,243 |
| Paraguayans | 99.9 /100 | #58 | Exceptional $43,173 |
| Estonians | 99.9 /100 | #59 | Exceptional $43,106 |
| Immigrants | Latvia | 99.9 /100 | #60 | Exceptional $43,099 |
| Immigrants | Bulgaria | 99.9 /100 | #61 | Exceptional $43,085 |
| Afghans | 99.9 /100 | #62 | Exceptional $43,077 |
| Immigrants | Ukraine | 99.9 /100 | #63 | Exceptional $43,069 |
| Immigrants | Pakistan | 99.9 /100 | #64 | Exceptional $43,052 |