Assyrian/Chaldean/Syriac vs Immigrants from Malaysia Householder Income Ages 45 - 64 years
COMPARE
Assyrian/Chaldean/Syriac
Immigrants from Malaysia
Householder Income Ages 45 - 64 years
Householder Income Ages 45 - 64 years Comparison
Assyrians/Chaldeans/Syriacs
Immigrants from Malaysia
$110,201
HOUSEHOLDER INCOME AGES 45 - 64 YEARS
99.3/ 100
METRIC RATING
72nd/ 347
METRIC RANK
$112,796
HOUSEHOLDER INCOME AGES 45 - 64 YEARS
99.8/ 100
METRIC RATING
52nd/ 347
METRIC RANK
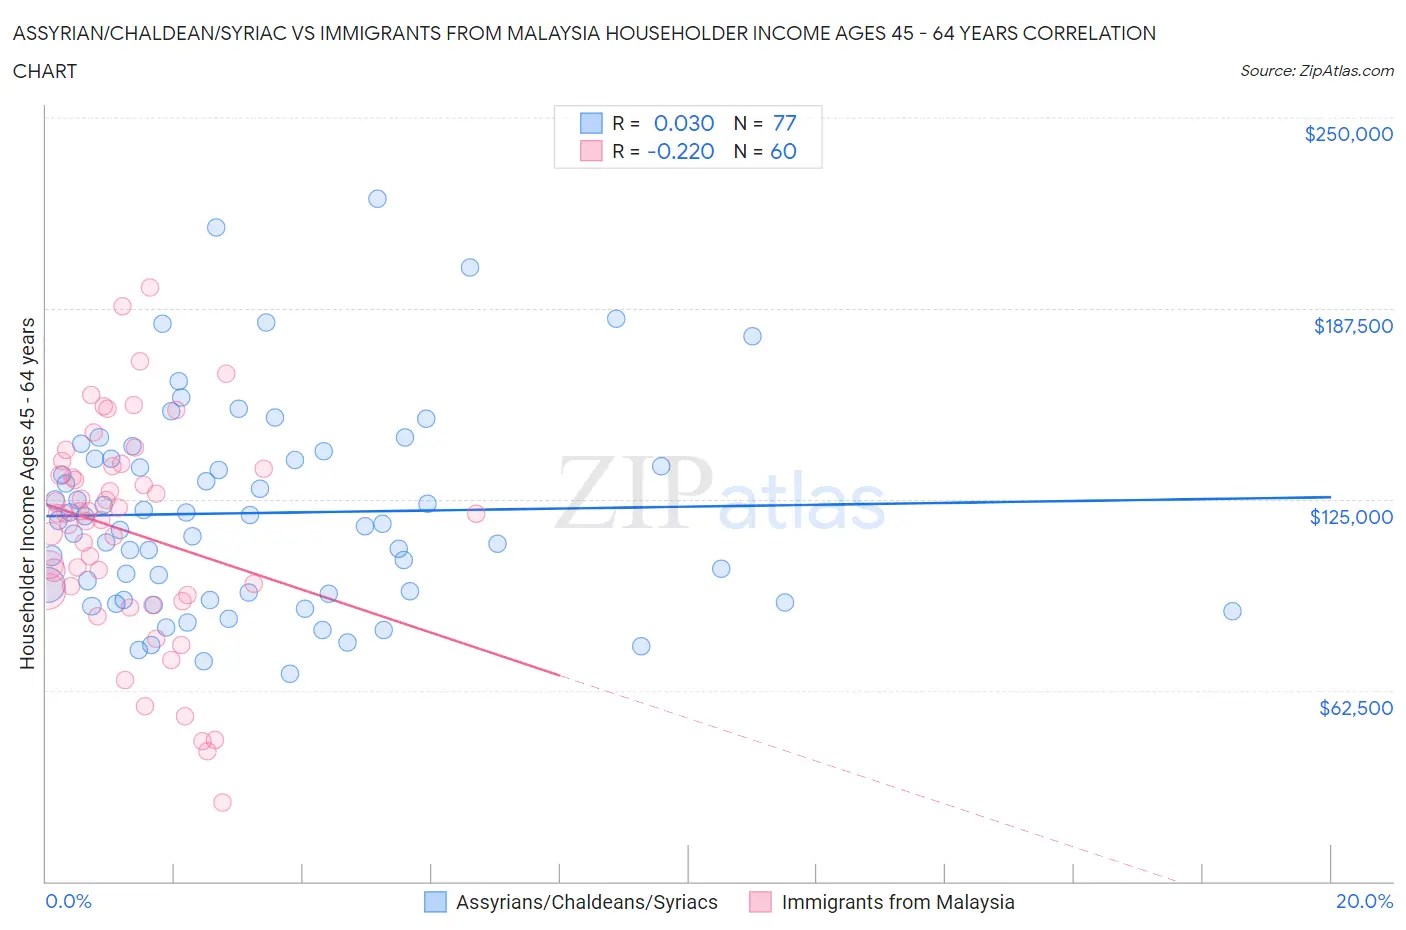
Assyrian/Chaldean/Syriac vs Immigrants from Malaysia Householder Income Ages 45 - 64 years Correlation Chart
The statistical analysis conducted on geographies consisting of 110,244,252 people shows no correlation between the proportion of Assyrians/Chaldeans/Syriacs and household income with householder between the ages 45 and 64 in the United States with a correlation coefficient (R) of 0.030 and weighted average of $110,201. Similarly, the statistical analysis conducted on geographies consisting of 197,847,367 people shows a weak negative correlation between the proportion of Immigrants from Malaysia and household income with householder between the ages 45 and 64 in the United States with a correlation coefficient (R) of -0.220 and weighted average of $112,796, a difference of 2.4%.
Householder Income Ages 45 - 64 years Correlation Summary
| Measurement | Assyrian/Chaldean/Syriac | Immigrants from Malaysia |
| Minimum | $67,992 | $25,952 |
| Maximum | $223,409 | $194,219 |
| Range | $155,417 | $168,267 |
| Mean | $120,547 | $114,501 |
| Median | $117,054 | $120,322 |
| Interquartile 25% (IQ1) | $93,085 | $94,457 |
| Interquartile 75% (IQ3) | $138,155 | $135,508 |
| Interquartile Range (IQR) | $45,070 | $41,051 |
| Standard Deviation (Sample) | $33,489 | $35,239 |
| Standard Deviation (Population) | $33,271 | $34,945 |
Demographics Similar to Assyrians/Chaldeans/Syriacs and Immigrants from Malaysia by Householder Income Ages 45 - 64 years
In terms of householder income ages 45 - 64 years, the demographic groups most similar to Assyrians/Chaldeans/Syriacs are Italian ($110,224, a difference of 0.020%), Korean ($110,334, a difference of 0.12%), Immigrants from Italy ($110,434, a difference of 0.21%), Immigrants from Romania ($110,633, a difference of 0.39%), and Laotian ($111,051, a difference of 0.77%). Similarly, the demographic groups most similar to Immigrants from Malaysia are Afghan ($112,676, a difference of 0.11%), Greek ($112,630, a difference of 0.15%), Lithuanian ($112,484, a difference of 0.28%), Egyptian ($112,256, a difference of 0.48%), and Immigrants from Scotland ($112,175, a difference of 0.55%).
| Demographics | Rating | Rank | Householder Income Ages 45 - 64 years |
| Immigrants | Malaysia | 99.8 /100 | #52 | Exceptional $112,796 |
| Afghans | 99.8 /100 | #53 | Exceptional $112,676 |
| Greeks | 99.8 /100 | #54 | Exceptional $112,630 |
| Lithuanians | 99.8 /100 | #55 | Exceptional $112,484 |
| Egyptians | 99.7 /100 | #56 | Exceptional $112,256 |
| Immigrants | Scotland | 99.7 /100 | #57 | Exceptional $112,175 |
| Soviet Union | 99.7 /100 | #58 | Exceptional $112,008 |
| Immigrants | Europe | 99.7 /100 | #59 | Exceptional $111,984 |
| Immigrants | Netherlands | 99.7 /100 | #60 | Exceptional $111,982 |
| Immigrants | Czechoslovakia | 99.7 /100 | #61 | Exceptional $111,914 |
| Immigrants | Norway | 99.7 /100 | #62 | Exceptional $111,669 |
| Mongolians | 99.6 /100 | #63 | Exceptional $111,602 |
| Immigrants | Latvia | 99.6 /100 | #64 | Exceptional $111,454 |
| Immigrants | Belarus | 99.6 /100 | #65 | Exceptional $111,430 |
| New Zealanders | 99.6 /100 | #66 | Exceptional $111,286 |
| Laotians | 99.5 /100 | #67 | Exceptional $111,051 |
| Immigrants | Romania | 99.4 /100 | #68 | Exceptional $110,633 |
| Immigrants | Italy | 99.4 /100 | #69 | Exceptional $110,434 |
| Koreans | 99.3 /100 | #70 | Exceptional $110,334 |
| Italians | 99.3 /100 | #71 | Exceptional $110,224 |
| Assyrians/Chaldeans/Syriacs | 99.3 /100 | #72 | Exceptional $110,201 |