Assyrian/Chaldean/Syriac vs Czech Householder Income Ages 45 - 64 years
COMPARE
Assyrian/Chaldean/Syriac
Czech
Householder Income Ages 45 - 64 years
Householder Income Ages 45 - 64 years Comparison
Assyrians/Chaldeans/Syriacs
Czechs
$110,201
HOUSEHOLDER INCOME AGES 45 - 64 YEARS
99.3/ 100
METRIC RATING
72nd/ 347
METRIC RANK
$103,507
HOUSEHOLDER INCOME AGES 45 - 64 YEARS
83.1/ 100
METRIC RATING
144th/ 347
METRIC RANK
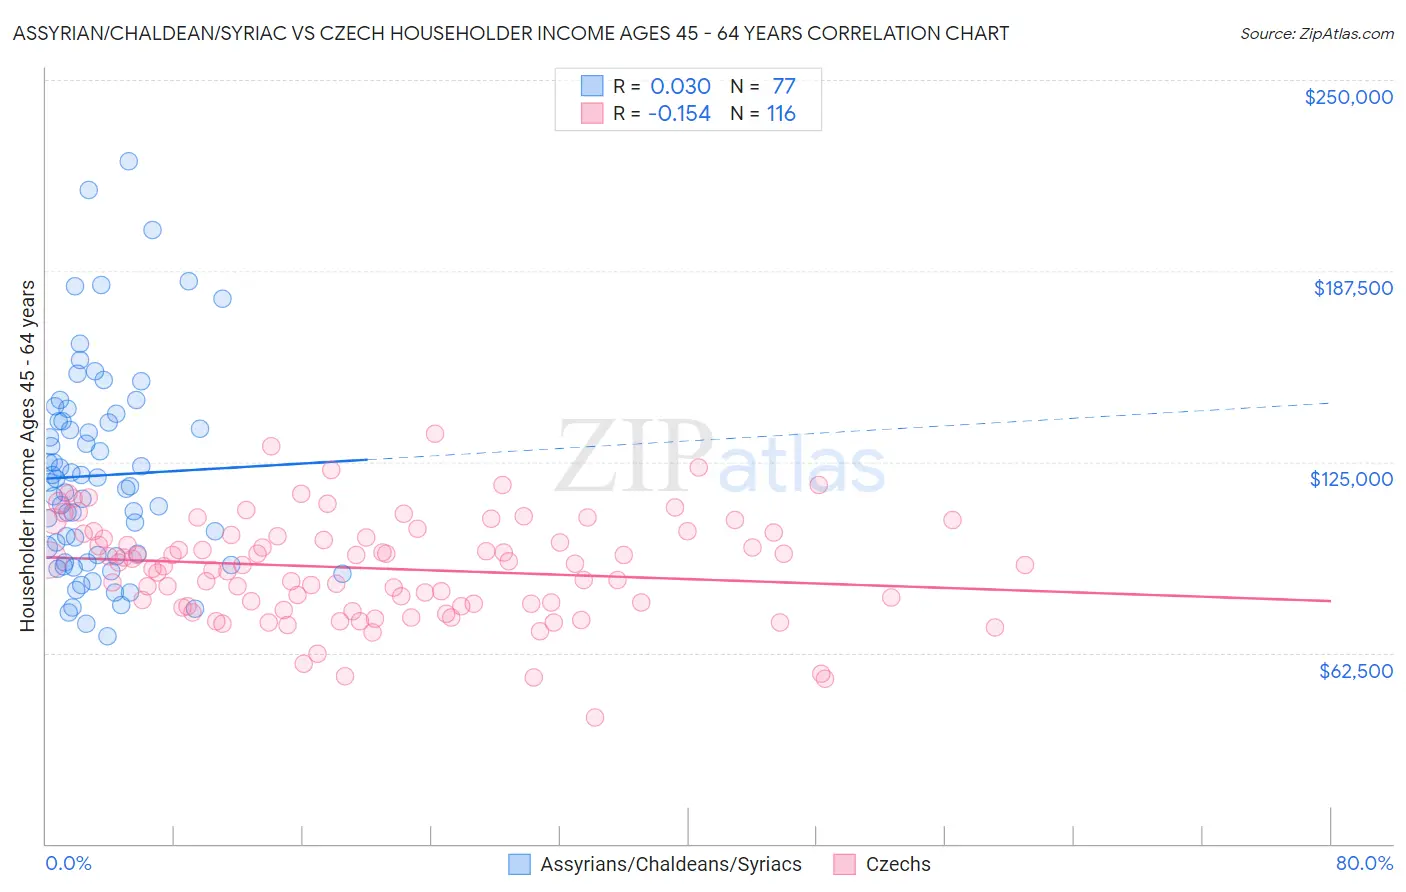
Assyrian/Chaldean/Syriac vs Czech Householder Income Ages 45 - 64 years Correlation Chart
The statistical analysis conducted on geographies consisting of 110,244,252 people shows no correlation between the proportion of Assyrians/Chaldeans/Syriacs and household income with householder between the ages 45 and 64 in the United States with a correlation coefficient (R) of 0.030 and weighted average of $110,201. Similarly, the statistical analysis conducted on geographies consisting of 483,421,339 people shows a poor negative correlation between the proportion of Czechs and household income with householder between the ages 45 and 64 in the United States with a correlation coefficient (R) of -0.154 and weighted average of $103,507, a difference of 6.5%.
Householder Income Ages 45 - 64 years Correlation Summary
| Measurement | Assyrian/Chaldean/Syriac | Czech |
| Minimum | $67,992 | $41,250 |
| Maximum | $223,409 | $134,167 |
| Range | $155,417 | $92,917 |
| Mean | $120,547 | $90,131 |
| Median | $117,054 | $91,354 |
| Interquartile 25% (IQ1) | $93,085 | $78,110 |
| Interquartile 75% (IQ3) | $138,155 | $101,246 |
| Interquartile Range (IQR) | $45,070 | $23,136 |
| Standard Deviation (Sample) | $33,489 | $16,799 |
| Standard Deviation (Population) | $33,271 | $16,726 |
Similar Demographics by Householder Income Ages 45 - 64 years
Demographics Similar to Assyrians/Chaldeans/Syriacs by Householder Income Ages 45 - 64 years
In terms of householder income ages 45 - 64 years, the demographic groups most similar to Assyrians/Chaldeans/Syriacs are Italian ($110,224, a difference of 0.020%), Argentinean ($110,103, a difference of 0.090%), Korean ($110,334, a difference of 0.12%), Immigrants from Italy ($110,434, a difference of 0.21%), and Immigrants from Egypt ($109,941, a difference of 0.24%).
| Demographics | Rating | Rank | Householder Income Ages 45 - 64 years |
| Immigrants | Belarus | 99.6 /100 | #65 | Exceptional $111,430 |
| New Zealanders | 99.6 /100 | #66 | Exceptional $111,286 |
| Laotians | 99.5 /100 | #67 | Exceptional $111,051 |
| Immigrants | Romania | 99.4 /100 | #68 | Exceptional $110,633 |
| Immigrants | Italy | 99.4 /100 | #69 | Exceptional $110,434 |
| Koreans | 99.3 /100 | #70 | Exceptional $110,334 |
| Italians | 99.3 /100 | #71 | Exceptional $110,224 |
| Assyrians/Chaldeans/Syriacs | 99.3 /100 | #72 | Exceptional $110,201 |
| Argentineans | 99.3 /100 | #73 | Exceptional $110,103 |
| Immigrants | Egypt | 99.2 /100 | #74 | Exceptional $109,941 |
| South Africans | 99.1 /100 | #75 | Exceptional $109,719 |
| Paraguayans | 99.0 /100 | #76 | Exceptional $109,447 |
| Immigrants | England | 99.0 /100 | #77 | Exceptional $109,446 |
| Immigrants | Canada | 99.0 /100 | #78 | Exceptional $109,402 |
| Immigrants | Bulgaria | 98.9 /100 | #79 | Exceptional $109,379 |
Demographics Similar to Czechs by Householder Income Ages 45 - 64 years
In terms of householder income ages 45 - 64 years, the demographic groups most similar to Czechs are Serbian ($103,522, a difference of 0.010%), Luxembourger ($103,536, a difference of 0.030%), Ugandan ($103,472, a difference of 0.030%), Immigrants from Uganda ($103,584, a difference of 0.070%), and Immigrants from Chile ($103,412, a difference of 0.090%).
| Demographics | Rating | Rank | Householder Income Ages 45 - 64 years |
| Hungarians | 85.8 /100 | #137 | Excellent $103,913 |
| Ethiopians | 84.7 /100 | #138 | Excellent $103,736 |
| Immigrants | Oceania | 84.5 /100 | #139 | Excellent $103,705 |
| Norwegians | 84.3 /100 | #140 | Excellent $103,682 |
| Immigrants | Uganda | 83.7 /100 | #141 | Excellent $103,584 |
| Luxembourgers | 83.3 /100 | #142 | Excellent $103,536 |
| Serbians | 83.2 /100 | #143 | Excellent $103,522 |
| Czechs | 83.1 /100 | #144 | Excellent $103,507 |
| Ugandans | 82.9 /100 | #145 | Excellent $103,472 |
| Immigrants | Chile | 82.5 /100 | #146 | Excellent $103,412 |
| Basques | 82.3 /100 | #147 | Excellent $103,387 |
| Immigrants | Germany | 81.5 /100 | #148 | Excellent $103,282 |
| Immigrants | Sierra Leone | 81.1 /100 | #149 | Excellent $103,227 |
| Immigrants | Peru | 80.7 /100 | #150 | Excellent $103,173 |
| Swiss | 79.9 /100 | #151 | Good $103,071 |